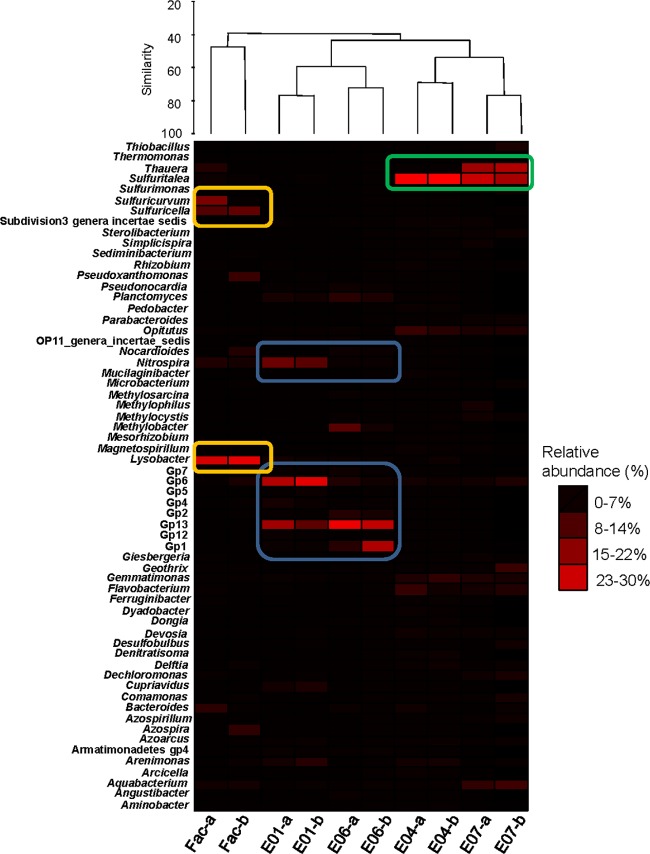
Fig 5.
Heat map of bacterial populations present in the groundwater at site E. Groundwater samples were clustered into three groups. Highly abundant bacterial populations associated with each group are boxed. Groundwater samples from each well were collected on June and July 2010 and are labeled with the name of the well followed by “a” and “b,” respectively.

