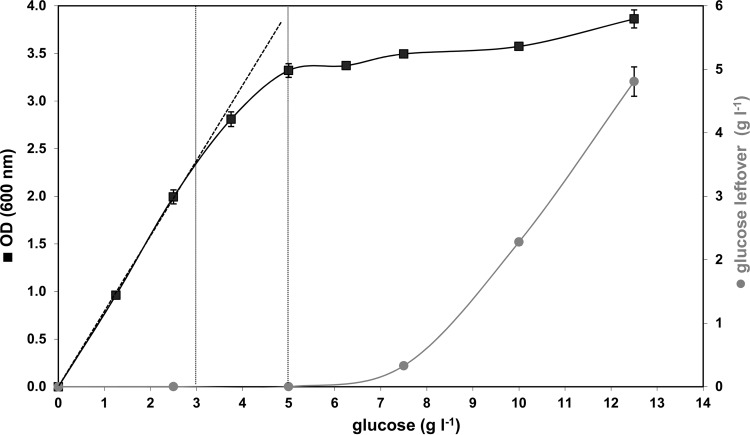
Fig 1.
Plot showing the final OD600s of L. monocytogenes batch cultured in carbon concentrations from 0 to 12.5 g glucose liter−1. A linear correlation between the final OD600 and the available carbon concentration in the medium is only given between 0 and 2.5 g glucose liter−1 (linear correlation is shown by the dashed lines). This indicates that the mineral medium is only glucose limited for concentrations up to 2.5 g liter−1. The gray curve (right axis) represents the residual carbon after the bacteria reached stationary phase. The error bars indicate the standard deviations of triplicate samples.

