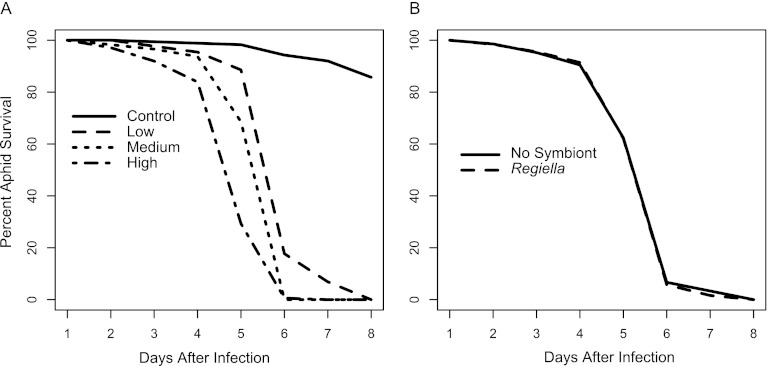
Fig 2.
Results of infection with Beauveria. Survival of each aphid was recorded every 24 h between 0 and 8 days after infection and is reported as survival curves measured in percent survival of each group. (A) Spore dose. Each line represents a different spore dose (control, 0 spores/aphid; low, 25; medium, 250; high, 2,500), n = 175 per dose. (B) Symbiont status. The solid line shows infected aphids without Regiella (n = 210). The dotted line shows infected aphids that harbored Regiella (n = 315).

