
Fig 2.
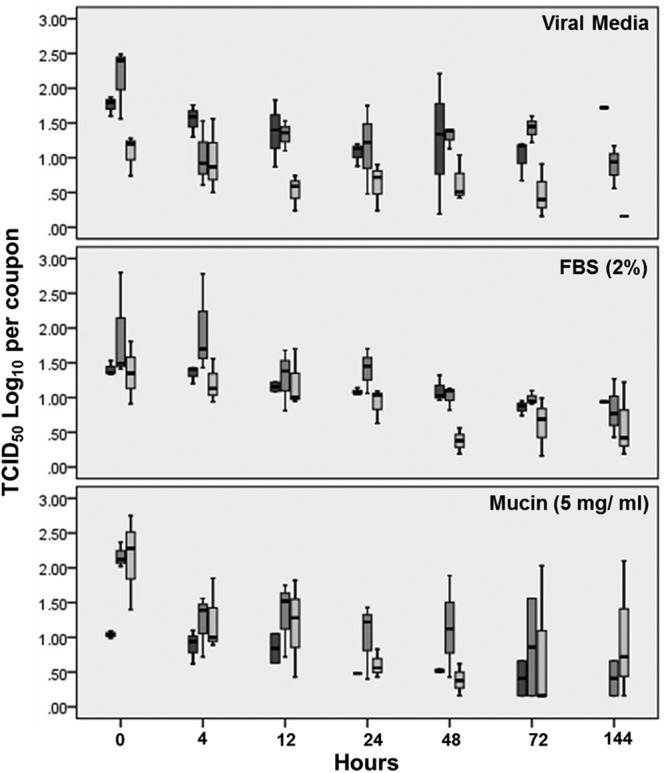
The pH1N1 virus TCID50 log10 concentration per coupon over time (6 days) for different matrices and absolute humidity (AH) levels, where the horizontal line in the middle mark of each bar represents the median, the top and bottom of the bars represent the 25th and 75th percentiles, respectively, and the error bars represent the 95% confidence intervals. The first, second, and third bars within each time point are the results from the 4.1 × 10⁵ mPa, 6.5 × 10⁵ mPa, and 14.6 × 10⁵ mPa AH conditions, respectively. Each box represents 3 coupons.