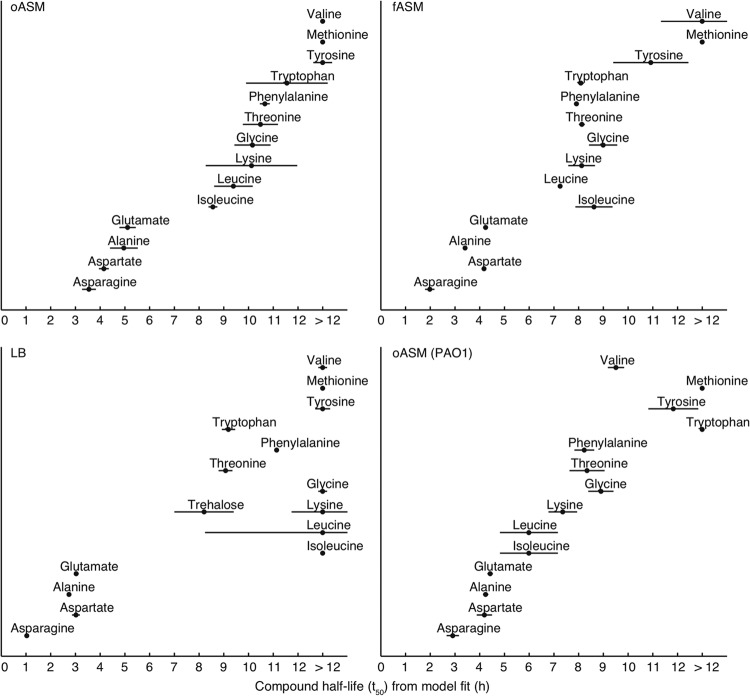
Fig 2.
The orders of uptake of metabolites are similar but not identical between rich media. The t1/2 (i.e., the time taken for half of the compound to be consumed) is represented by dots, and the period during which the compound is taken up at the maximum rate is represented by horizontal lines; both of these are based on fitting sigmoid models to metabolite concentration data. (A) Unfiltered ASM; (B) filtered ASM; (C) LB.

