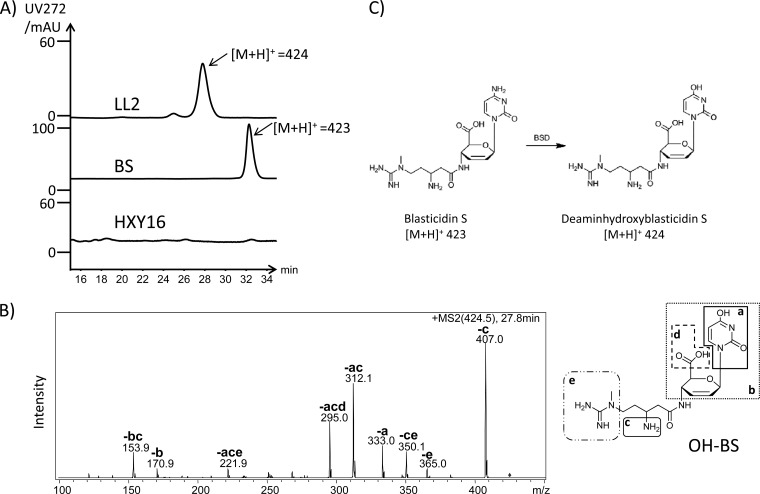
Fig 3.
LC-MS analysis of the metabolite production of S. lividans LL2. (A) High-performance liquid chromatography comparison of the blasticidin S standard to the purified fermentation broth of S. lividans LL2 and S. lividans HXY16. LC-MS analysis revealed the peak presented in the fermentation broth of LL2, having a dominant peak at m/z 424. (B) MS/MS analysis of the m/z 424 parent ion. Each daughter peak (corresponding structures are shown in the inset) labeled could be derived from deaminohydroxyblasticidin S. (C) Blasticidin S was transformed to deaminohydroxyblasticidin S by BSD. BS, blasticidin S; AU, arbitrary units.

