
Fig 2.
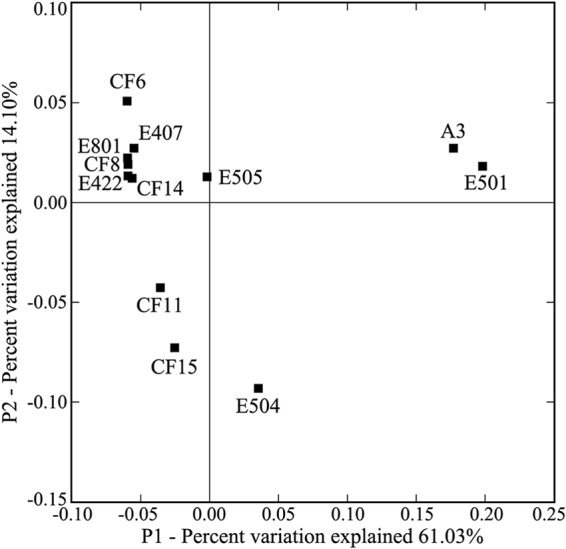
Ordination diagram of the surface sediment AEA assemblages from the nSCS calculated with weighted UniFrac PCoA analysis. Shown is the plot of the first two principal-coordinate axes (P1 and P2) for PCoA and the distributions of the AEA assemblages (designated by the sampling station names) in response to these axes.