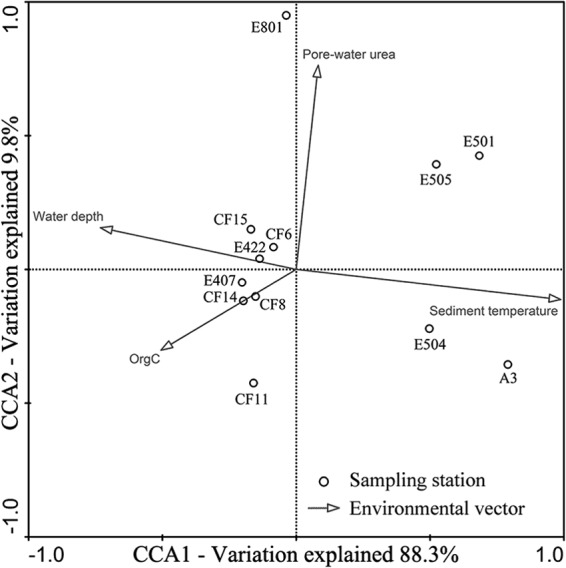
Fig 4.

CCA ordination plot for the first two dimensions (CCA1 and CCA2) showing the relationship between the surface sediment fossil archaeal assemblages from the nSCS and environmental parameters analyzed using the archaeal membrane core lipid data.
