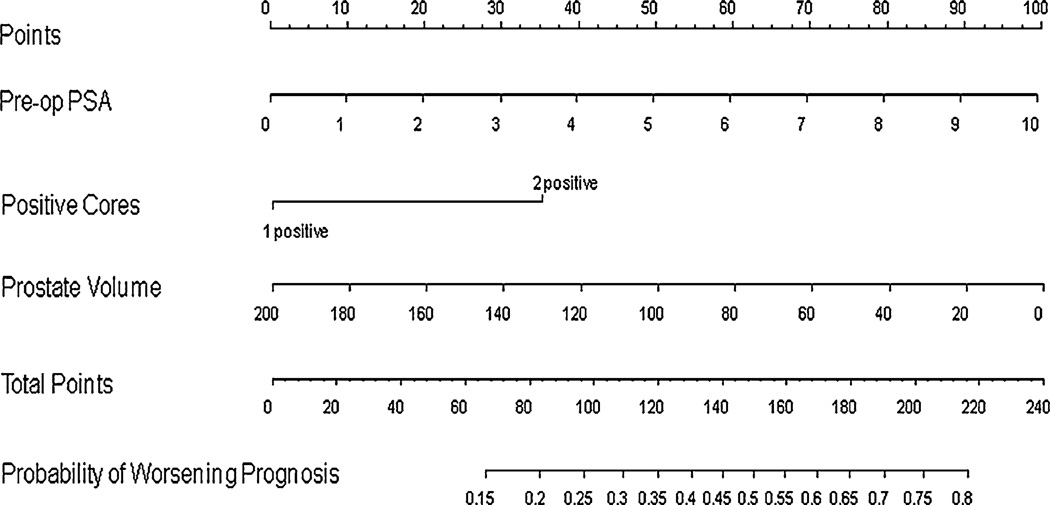
Fig. 3.
Nomogram for the prediction of worsening prognosis in potential active surveillance patients. Nomogram instructions: To obtain the nomogram-predicted probability of worsening prognosis, locate patient values on each axis. Draw a vertical line to the ‘Points’ axis to determine how many points are attributed for each variable value. Sum the points for all variables. Locate the sum on the ‘Total Points’ line to assess the individual probability of worsening prognosis on the ‘Probability of Worsening Prognosis’ line

