Fig. 1.
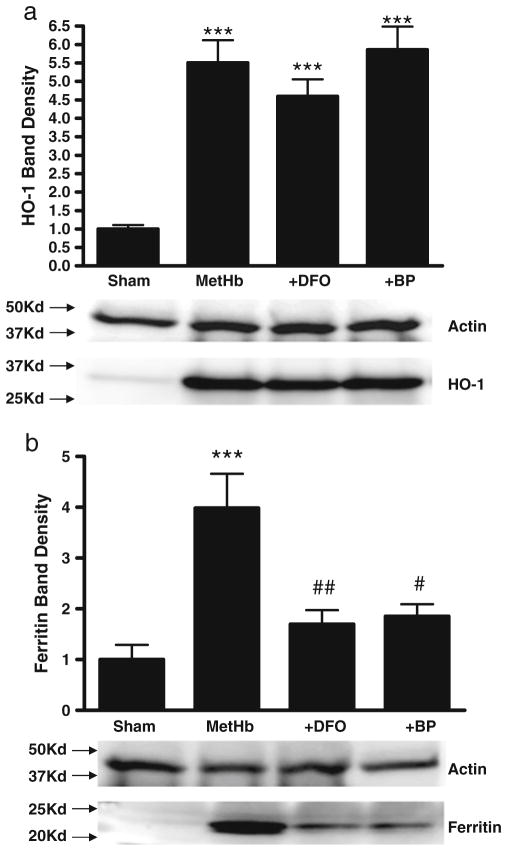
Iron chelators reduce ferritin induction by methemoglobin. Bars represent mean HO-1 (a) or ferritin (b) band densities in lysates of cultures (5/condition) treated with 3 μM methemoglobin (MetHb) for 24 hours, alone or with 100 μM of either deferoxamine (DFO) or 2,2′-bipyridyl (BP), expressed as a multiple of the mean value in control cultures subjected to sham medium changes only (= 1). Lane order of representative immuno-blots is same as bar order; actin is gel-loading control. ***P<0.001 v. sham controls, #P<0.05, ##P<0.01 v. metHb alone condition

