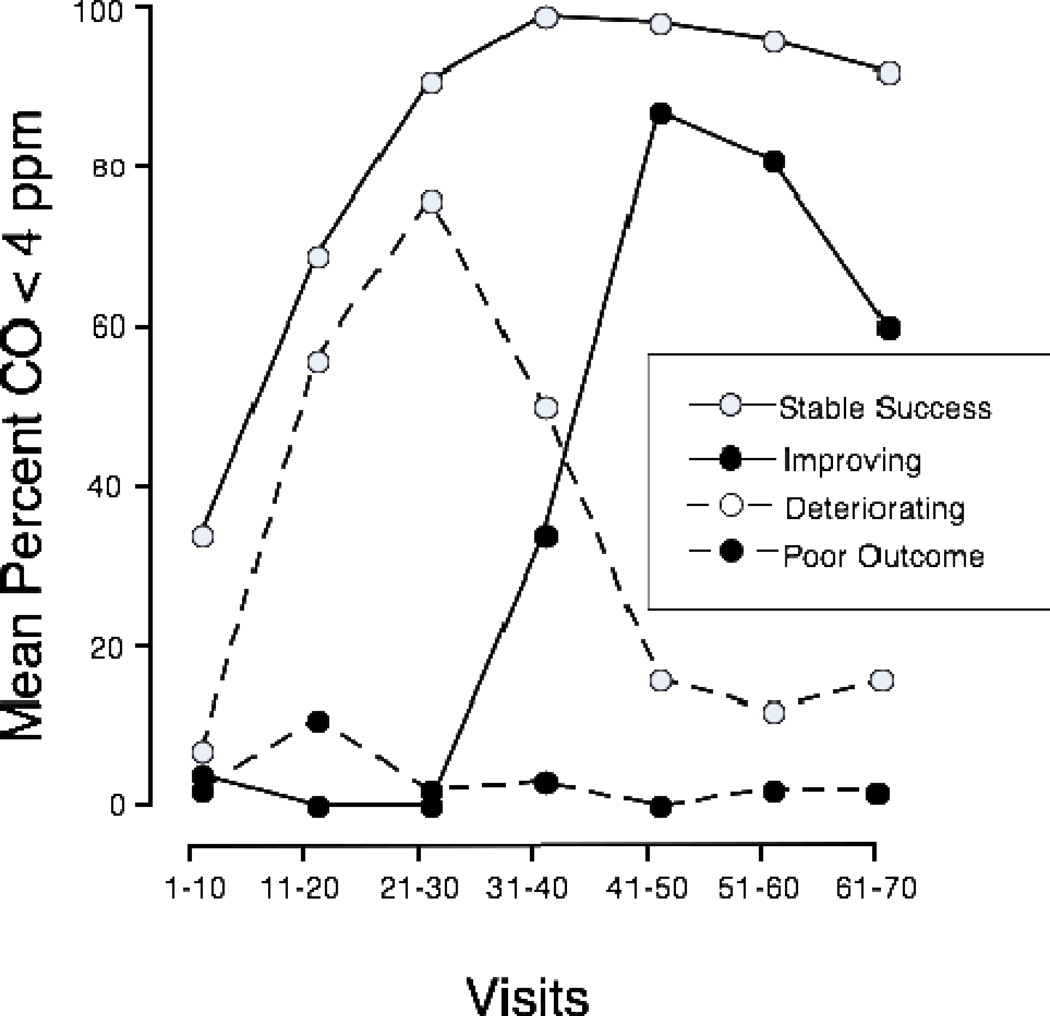
Figure 2.
Outcome trajectories for the four-cluster solution. The mean percentage of breath samples meeting the criterion for 1-day abstinence (i.e., CO < 4 ppm) are shown for each cluster in each block of 10 study visits. Dashed lines represent unsuccessful outcomes (poor outcomes –filled points, N=52; and deteriorating – open points, N=19) and solid lines represent successful outcomes (stable success – open points, N=66; and improving – filled points, N=9).

