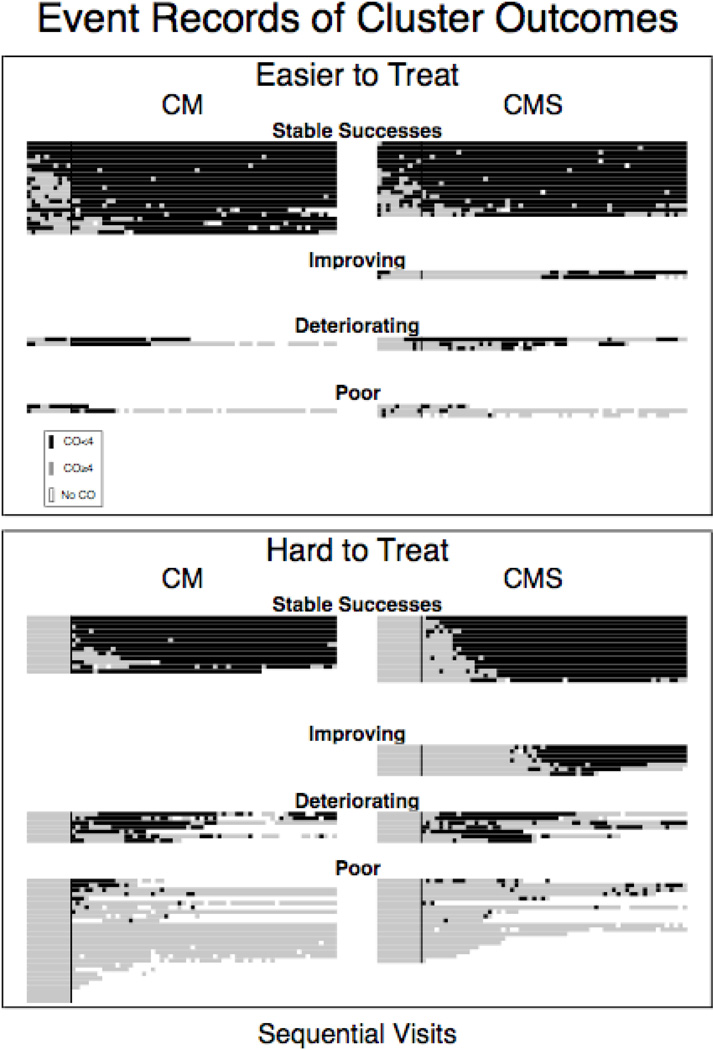
Figure 3.
Event records for each individual grouped together into clusters. Top panel presents data for the Easier to Treat, who had a CO < 4 ppm before the start of the interventions at visit 11. Bottom panel presents data for the Hard to Treat, who did not have a CO < 4 ppm before the start of the intervention. Dark spaces represent breath CO levels < 4 ppm, while lighter spaces represent breath CO levels ≥ 4 ppm. Empty spaces represent missed visits. The Horizontal axis is sequential visits and each ‘line’ of data represents an individual subject. The vertical line in each column separates the tenth and eleventh visit and indicates when the experimental contingencies went into effect. The left column is participants receiving CM, and the right column is participants receiving CMS.

