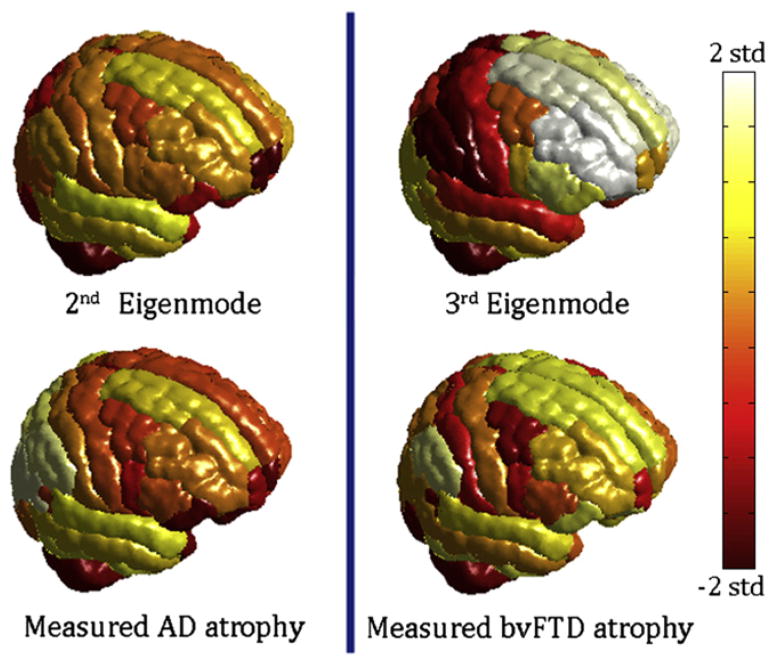
Figure 5. Cortical Atrophy and Eigenmodes Mapped onto the Cortical Surface using a Different Atlas.
Scores are mapped onto the cortical surface using the 86-region FreeSurfer atlas. Volumetric data were obtained by the FreeSurfer software and the brain network was also recomputed under this new parcellation. Measured atrophy patterns generally match the cortical atrophy seen using the AAL atlas (Figure 4), but exact match is not to be expected due to both methodological and ROI size and shape differences. It is important to note, however, that measured atrophy is still roughly in accordance with the eigenmodes, which remain consistent with classic AD/bvFTD pathology.

