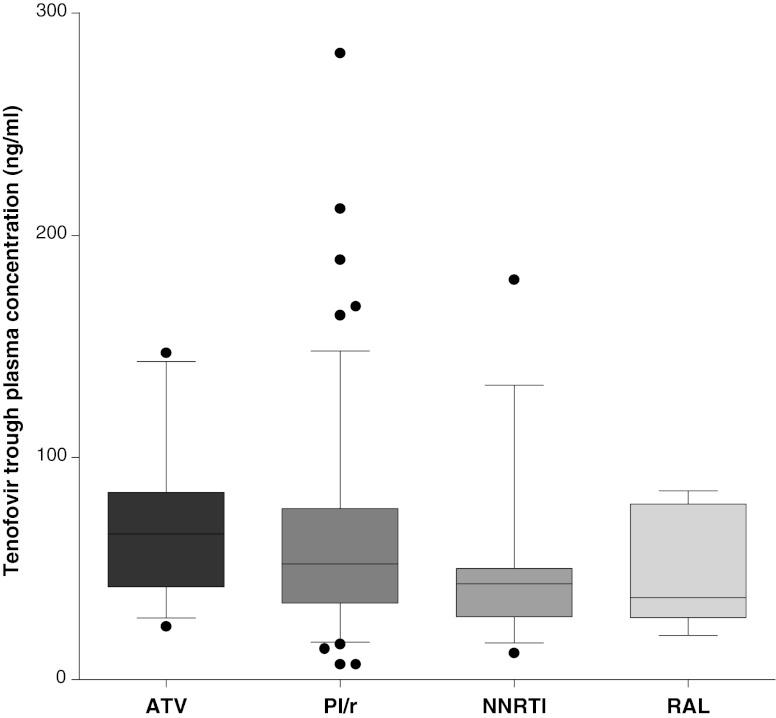
Fig 1.
Tenofovir plasma trough concentrations (ng/ml) according to different third-drug classes. Boxplots and whiskers represent median values, interquartile ranges, and 95% confidence intervals, respectively; black dots are single outliers. Median values and 95% confidence intervals are 65.5 ng/ml (27.7–143.2) in the ATV (atazanavir), 51.5 ng/ml (16.9–146.9) in the PI/r (boosted protease inhibitor), 43 ng/ml (16.5–132.5) in the NNRTI (nonnucleoside reverse transcriptase inhibitor), and 37 ng/ml (20–84.8) in the RAL (raltegravir) groups.

