Fig 2.

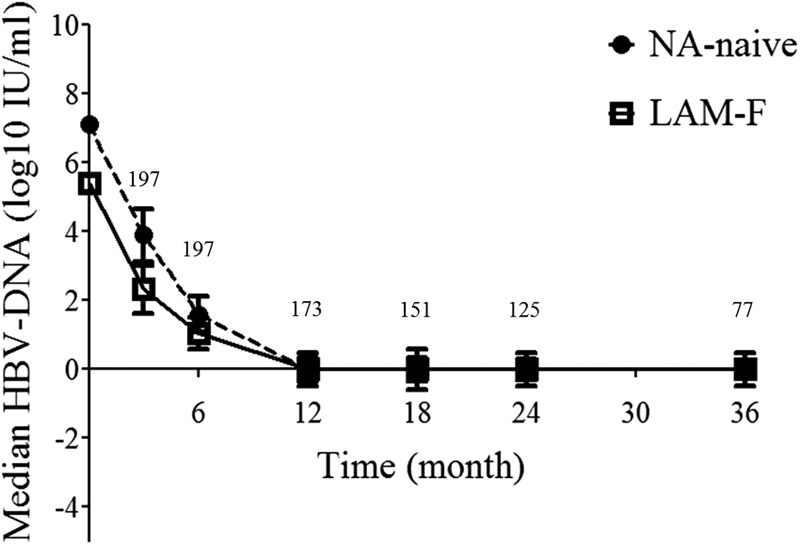
Changes in the median HBV DNA level were similar in the two groups. Error bars represent the standard errors of the means. The number of patients is shown for each time point above the curve.

Changes in the median HBV DNA level were similar in the two groups. Error bars represent the standard errors of the means. The number of patients is shown for each time point above the curve.