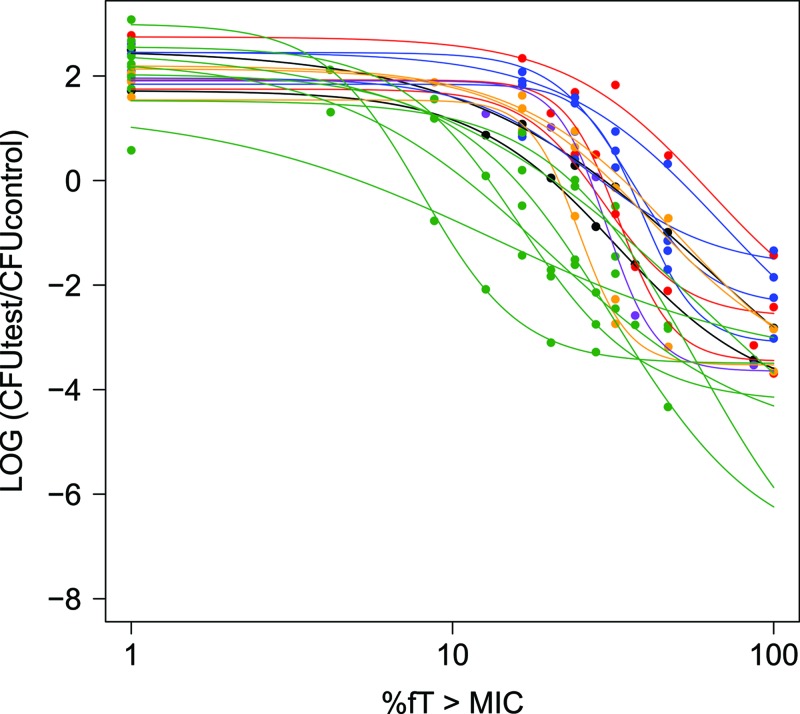
Fig 3.
Plots of the separate Hill models derived using population analyses for each of the 20 bacterial strains (lines) overlaid on the raw data points (individual symbols), illustrating the variability between bacterial species. Different colors correspond to the six different bacterial species included in the present investigation, namely, E. cloacae (black), E. coli (orange), K. pneumoniae (blue), P. aeruginosa (purple), S. aureus (red), and S. pneumoniae (green).

