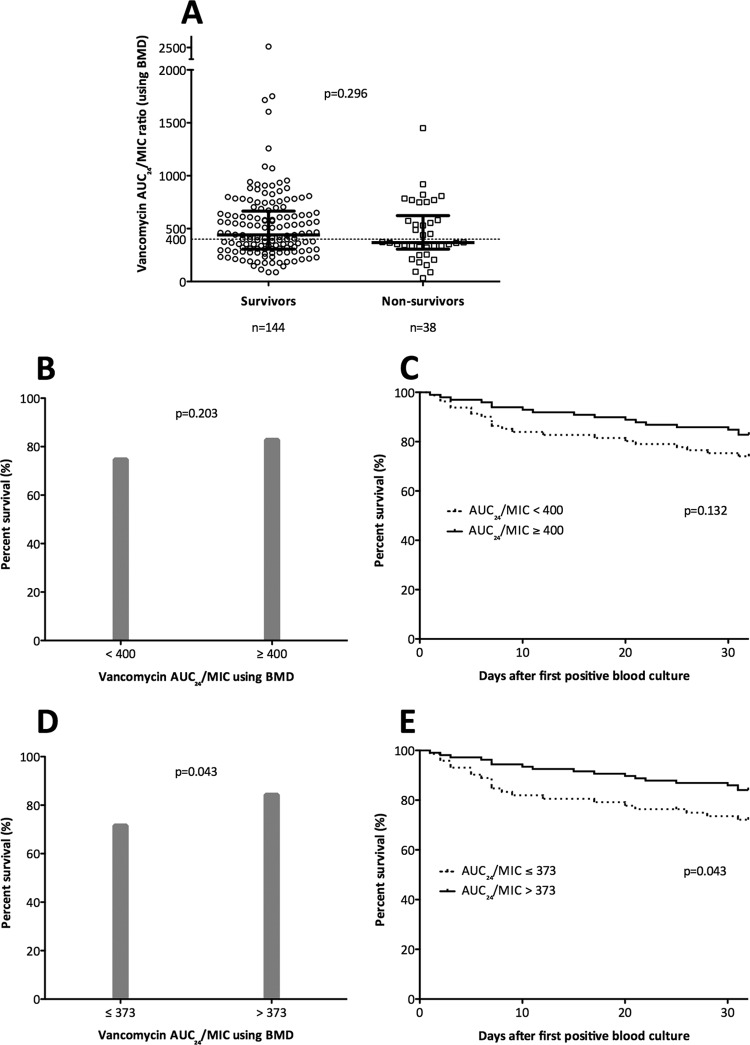
Fig 3.
Thirty-day mortality in patients with SAB according to vancomycin AUC/MIC. (A) Vancomycin AUC/MIC according to survivors versus nonsurvivors for all-cause mortality. (B) Proportion of survivors according to target attainment using a vancomycin AUC/MIC of ≥400. (C) Kaplan-Meier curve for all-cause mortality according to target attainment using a vancomycin AUC/MIC of ≥400 (note that the P value derived using the log-rank test was slightly different to Fisher's exact test for the dichotomous variable). (D) Proportion of survivors according to target attainment using a vancomycin AUC/MIC of ≥373. (E) Kaplan-Meier curve for all-cause mortality according to target attainment using a vancomycin AUC/MIC of ≥373. The horizontal dotted line represents an AUC/MIC of 400 using BMD. Heavy black bars represent median and interquartile range. BMD, broth microdilution; AUC/MIC, ratio of area under the concentration-time curve (24 hour) to vancomycin MIC.

