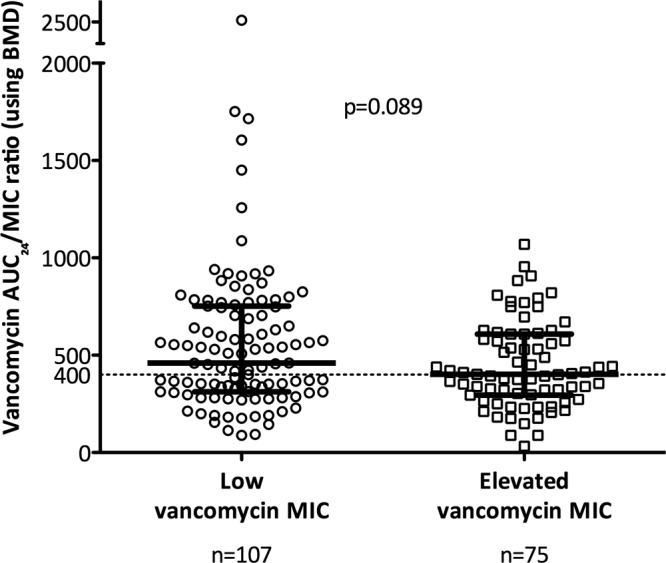
Fig 4.

Vancomycin AUC/MIC according to groups with low versus elevated (defined as an Etest value of >1.5 mg/liter) vancomycin MIC. The horizontal dotted line represents an AUC/MIC of 400 using BMD. Heavy black bars represent median and interquartile range. BMD, broth microdilution; AUC/MIC, ratio of area under the concentration-time curve (24 hour) to vancomycin MIC.
