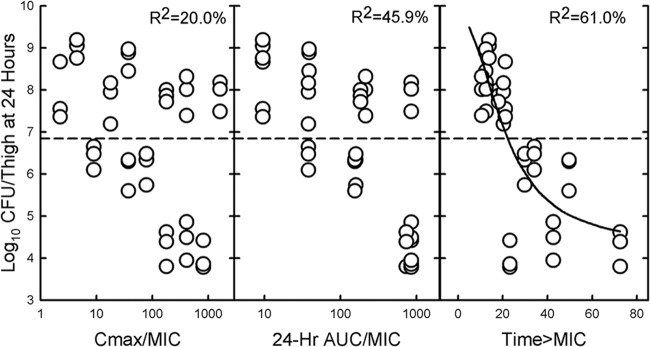
Fig 2.

Relationship between the CFU/thigh for K. pneumoniae ATCC 43816 and Cmax/MIC ratio (left panel), the AUC0-24/MIC ratio (center panel), and the percent T>MIC (right panel) after 24 h of treatment with ceftolozane administered at different doses and dosing intervals. Each point represents one mouse. R2 represents the percentage of variance in CFU/thigh that can be attributed to each PK/PD index.
