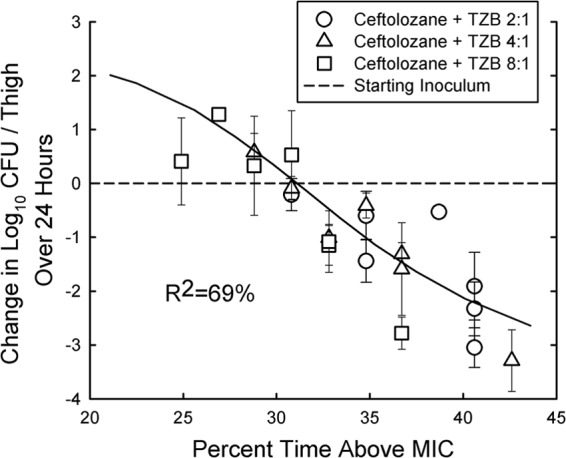
Fig 5.

Relationship between the percent T>MIC and the change in CFU/thigh over 24 h for five ESBL-producing Enterobacteriaceae after 6-hourly therapy with 400 and 800 of ceftolozane mg/kg in combination with tazobactam (TZB) at 2:1, 4:1, and 8:1 ratios. Each point represents the mean of three mice, and the error bar represents the SD. R2 represents the percentage of variance in CFU/thigh that can be attributed to the percent T>MIC.
