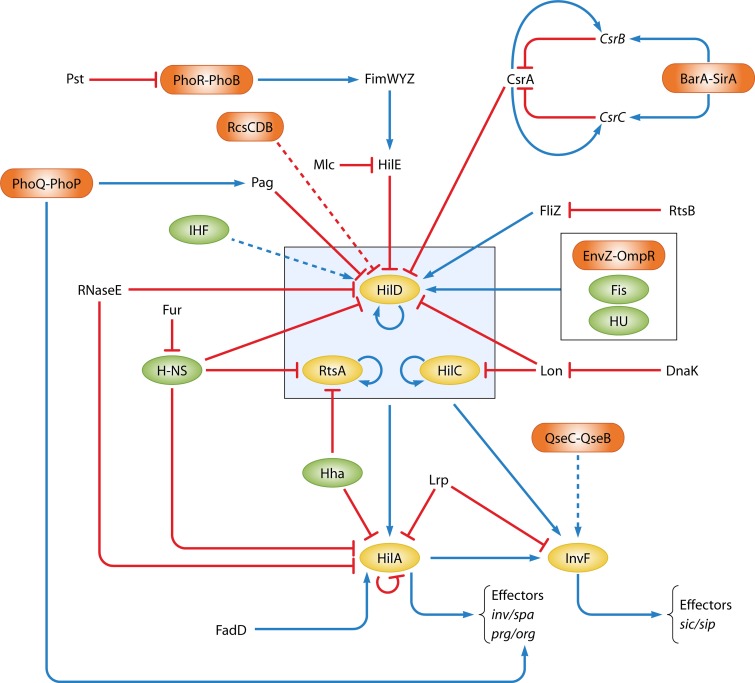
Fig 3.
SPI-1 regulatory network. Blue arrows indicate activation or autoactivation, whereas red blunt-end arrows indicate repression or autorepression. Discontinuous arrows suggest the putative regulatory target proposed in this model. Regulators in yellow are those encoded within SPI-1 (with the exception of RtsA) that play a critical role in the regulation of the invasion phenotype. Green refers to NAPs, whereas light orange is used for 2CRSs. The positive regulatory interactions between HilD, HilC, and RtsA have been omitted to avoid complicating the figure. The putative direct activation of HilA by SirA has not been included in this model due to lack of corroborative data. IHF activation is deduced to be mediated through HilD as for Fis and HU according to the information provided in the text. The PhoQ-PhoP repressive effect on the prg genes is proposed to occur through repression of HilA by means of posttranscriptional repression of HilD, since no direct effect has been reported in these SPI-1 genes. According to this model, all the 2CRSs exert their effect through HilD, with the exception of QseC-QseB, which is currently known to affect only InvF. For this reason, we have used a discontinuous arrow despite the possibility that it may also be acting at the level of HilD. Moreover, most of the regulatory signals are integrated at the level of HilD, mainly by posttranscriptional modulation, which heads the hierarchy of the SPI-1-encoded regulators.

