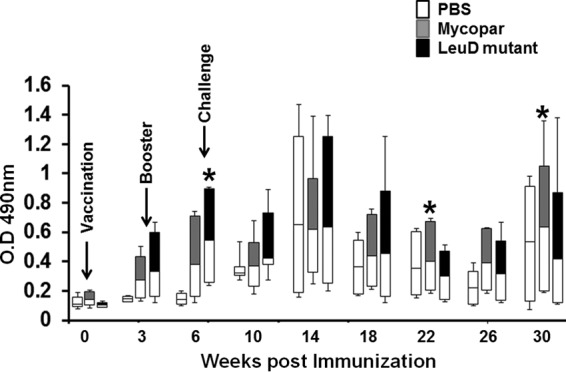
Fig 1.

Antibody response. Sera isolated from blood collected at different time points were diluted (1:200) and analyzed for PPDj-specific IgG antibodies by indirect ELISA, as described in Material and Methods. The response was measured in individual goats, and data are presented in the form of whisker-box plots. The white box indicates the lower quartile (25% of data greater than this value), the shaded box indicates the upper quartile (25% of data less than this value), the middle line is the median (50% of data greater than this value), and error bars indicate the minimum and maximum values. *, P < 0.05, ΔleuD versus Mycopar.
