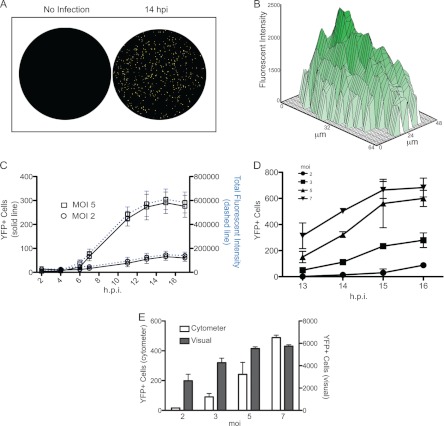
Fig 3.
Characterization of AD169IE2-YFP-infected cells. (A and B) Mock- or AD169IE2-YFP-infected MRC5 cells (MOI of 5) analyzed with an Acumen eX3 laser scanning fluorescence microplate cytometer demonstrated points of intense fluorescence signal (A) distributed throughout the infected-cell nucleus (B). (C) The fluorescence signal from AD169IE2-YFP-infected cells (MOI of 2 or 5) up to 17 hpi was measured by using a microplate cytometer. The number of YFP-positive cells per well (left axis) and the total fluorescence intensity in each well (right axis) were plotted over the course of infection. (D) Furthermore, the number of YFP-positive cells per well from AD169IE2-YFP-infected cells at between 13 and 16 hpi at an MOI of 2, 3, 5, or 7 was measured by using a microplate cytometer. The 2-way ANOVA test showed a significant effect at all MOIs and time points tested (P < 0.05). (E) The number of YFP-positive cells from AD169IE2-YFP-infected cells (MOIs of 2, 3, 5, and 7) at 14 hpi was measured by using a fluorescence cytometer (left axis) or by visual counting using a wide-field fluorescence microscope (right axis). Error bars represent standard errors of means.

