
Fig 4.
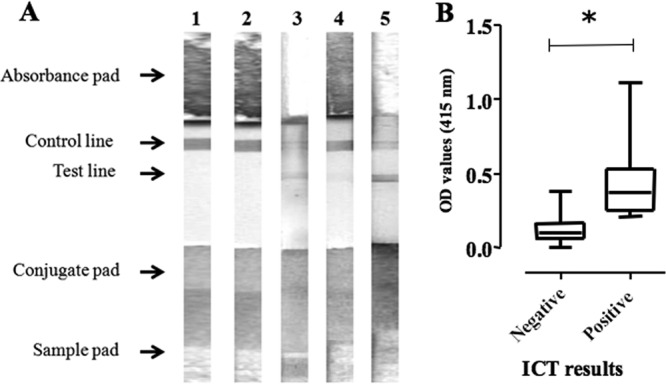
The diagnostic performance of ICT with TgGRA7. (A) Representative images of the ICT reaction with mouse and swine sera are shown. Lane 1, SPF mouse; lane 2, N. caninum-infected mouse; lane 3, T. gondii-infected mouse; lane 4, iELISA with TgGRA7-negative and LAT-negative pig; lane 5, iELISA with TgGRA7-positive and LAT-positive pig. (B) Comparison of the ICT results and the OD values from iELISA with TgGRA7. The interquartile range values (25-50-75%) are shown as boxes and whiskers. The asterisk indicates a significant difference by Student's t test (P < 0.05).