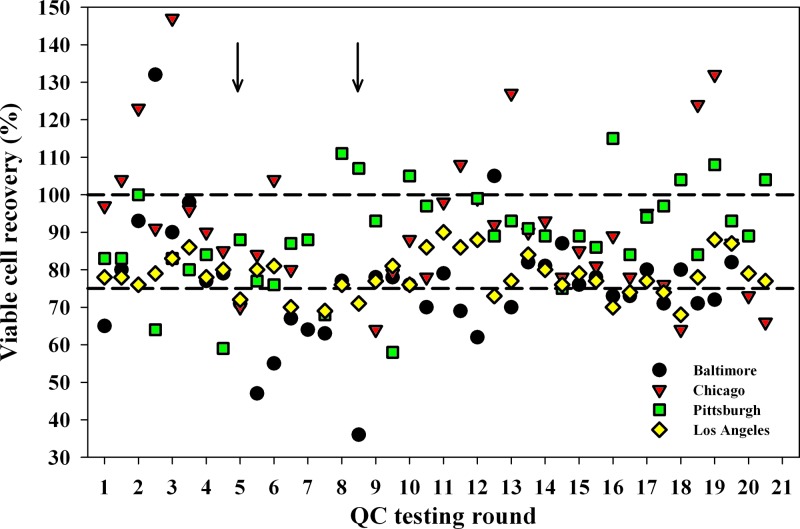
Fig 2.
Viable cell recovery from each vial of cryopreserved PBMC from 75 HIV-uninfected and 76 HIV-infected participants. Numbers on the x axis represent sequential times when cryopreserved PBMC from the four MACS sites were tested. The QA testing program was started in July 2004 and was performed every 4 months. The first symbol in each testing round for each of the MACS sites is the value for the HIV-uninfected participants, and the second symbol is the value for the HIV-infected participants. The dashed lines represent 75% and 100% viable cell recoveries.

