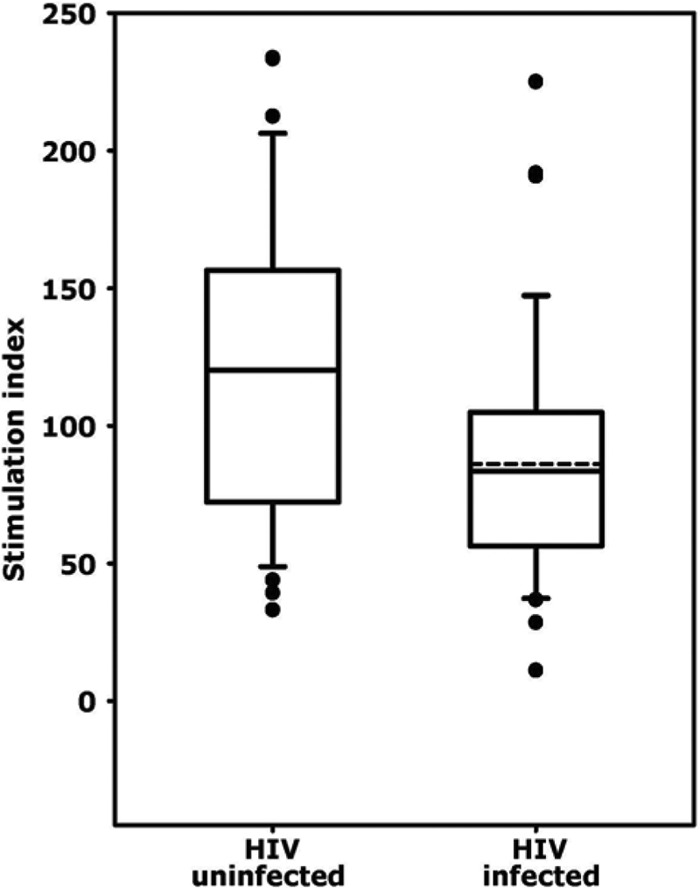
Fig 3.

Proliferative responses of cryopreserved PBMC (n = 28 per group) to phytohemagglutinin (PHA). The stimulation index was defined as the counts per minute in the presence of PHA divided by the counts per minute in the absence of PHA. The solid lines represent medians, and the dashed lines represent the means of the distributions. For HIV-uninfected samples the median and mean were the same. The boxes represent the 25th to 75th percentiles. The lower and upper horizontal bars indicate the 10th and 90th percentiles, respectively.
