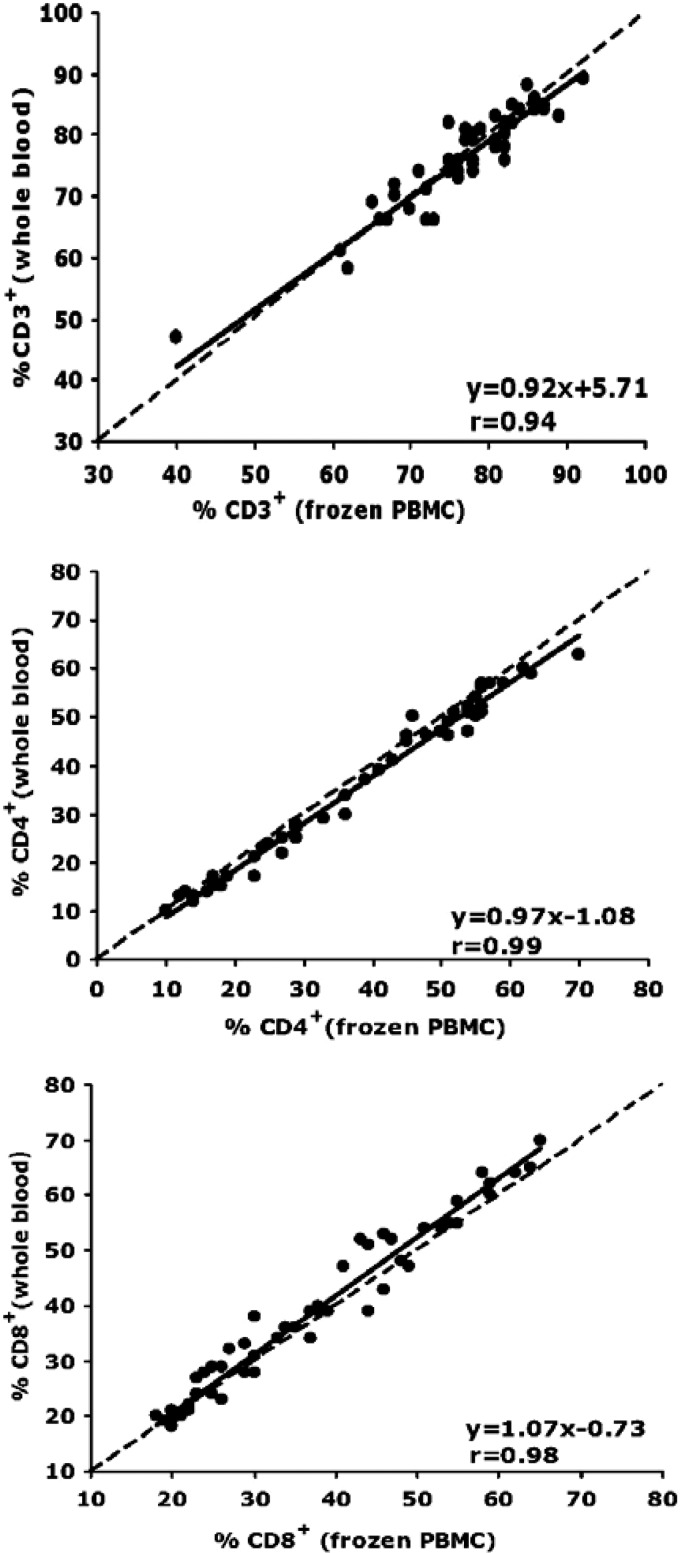
Fig 5.
Deming regression analyses of expression of cell surface markers CD3 (top panel), CD4 (middle panel), and CD8 (bottom panel) on paired samples of fresh whole-blood and cryopreserved PBMC. A total of 54 paired blood samples (27 from HIV-uninfected and 27 from HIV-infected participants) from the 4 MACS sites were evaluated. The dashed lines represent the line of identity (y = x), and the solid lines represent the least-squares regression lines of the data.

