Fig 1.
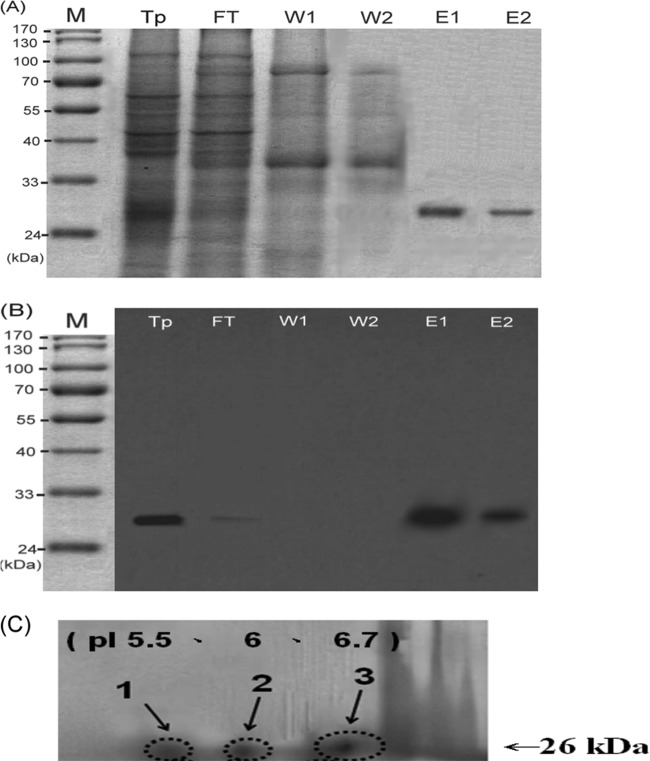
(A) SDS-PAGE analysis of T. putrescentiae GSTs. Electrophoresis was performed on a 12% gel. Lane M, molecular markers (kDa values are indicated by the scale on the left); T. putrescentiae (Tp), 20-μg crude extract of T. putrescentiae; FT, flow through of crude extract; W1, wash with 100 ml PBS; W2, wash with the second 100 ml PBS; E1 and E2, eluates with 10 mM reduced glutathione. (B) Western blot analysis of T. putrescentiae GSTs. The proteins were transferred to a membrane and blotted with mouse anti-Schistosoma japonicum GST serum. (C) Two-dimensional electrophoresis of T. putrescentiae GSTs. The first dimension is isoelectric focusing, which separates proteins according to their isoelectric point (pI); the second dimension is SDS-PAGE, according to the molecular masses. The isoelectric focusing was performed with linear pHs ranging from 3 to 10.

