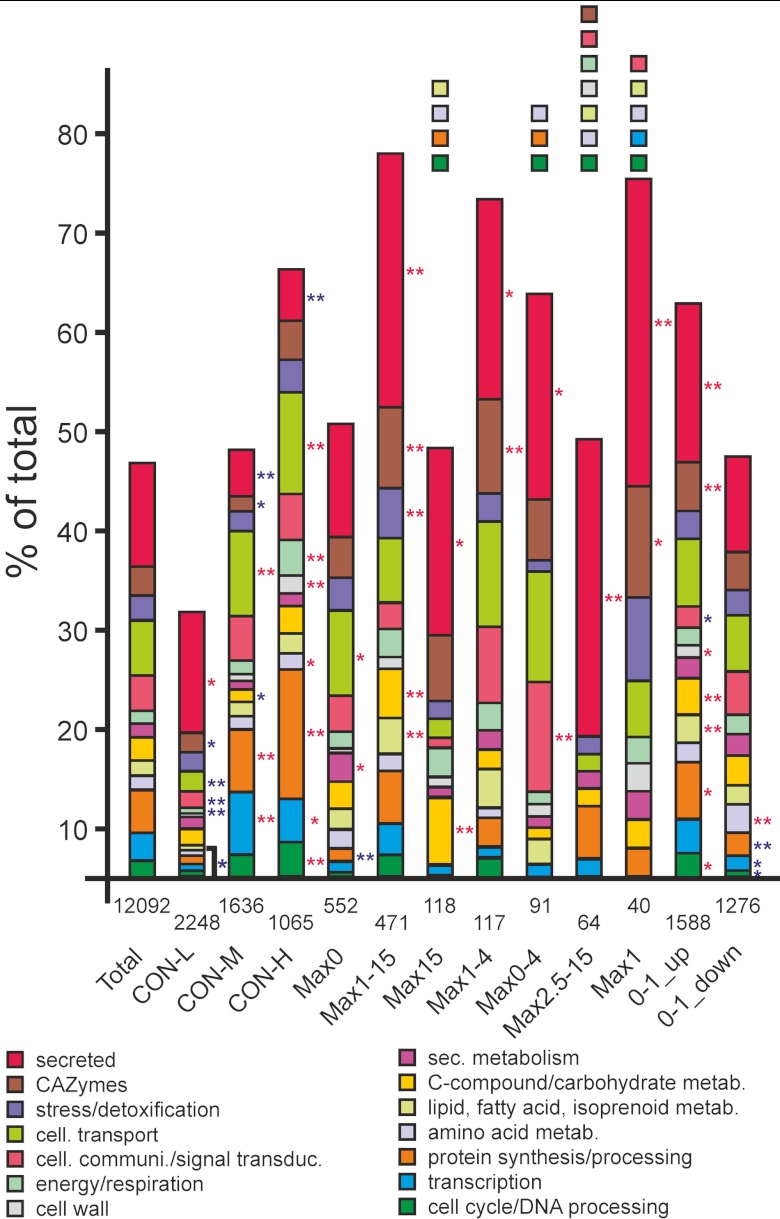
Fig 6.
Distribution of functional categories among genes belonging to different expression groups. For each functional category, the observed percentage of genes within the group is shown. Numbers indicate the total number of genes in each group. Asterisks indicate P values showing significant differences between observed and expected frequencies for a functional category within the total number of genes in the respective group (*, P < 0.01; **, P < 0.001; Fisher test). Red asterisks indicate overrepresentation and blue asterisks underrepresentation. The colored boxes above the bars indicate functional categories that are absent.

