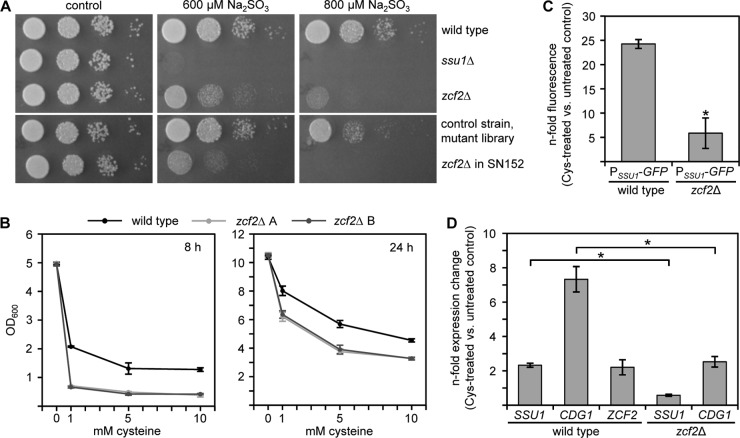
Fig 4.
Zcf2 supports sulfite and cysteine tolerance and governs cysteine-inducible SSU1/CDG1 expression. (A) Overnight cultures of wild type, SSU1M4A (ssu1Δ), and ZCF2M4A/B (zcf2Δ) were serially diluted and inoculated on YPD-TA agar plates containing sodium sulfite as indicated, or without sulfite for control. The two independently constructed zcf2Δ mutants behaved identically, and the results for only one of them are shown. The zcf2Δ mutants (zcf2Δ in SN152) and the corresponding control strain from the originally screened transcription factor mutant library were also included (lower panel). Photographs were taken after 28 h of growth at 30°C. (B) C. albicans overnight cultures of wild-type and ZCF2M4A/B (zcf2Δ A/B) strains were diluted 1:100 in fresh SD medium containing cysteine as indicated. The optical densities of the cultures were measured after growth for 8 h and 24 h at 30°C. The results are means ± the SD from three independent experiments. The addition of cysteine to the medium significantly reduced the growth of the zcf2Δ mutant compared to the wild type. (C) The fluorescence of C. albicans cells of reporter strains SSU1G1A/B (PSSU1-GFP/wild type) and ZCF2SSU1G1A/B (PSSU1-GFP/zcf2Δ) was measured by flow cytometry after growth for 6 h in SD medium containing 1 mM cysteine. The bars represent the n-fold fluorescence intensities measured in the presence versus absence of cysteine for each strain. The results are means ± the SD from three independent experiments. An asterisk (*) indicates that the detected differences were significant (P < 0.05). The two independently constructed A/B reporter strains behaved identically, and the results for only one of them are shown. (D) qRT-PCR measurements show an upregulation of CDG1, SSU1, and ZCF2 gene expression levels in the wild type after growth for 6 h in SD medium in the presence or absence of 1 mM cysteine, whereas expression levels of SSU1 and CDG1 are decreased in the zcf2Δ mutant. The results are means ± the SD from three independent experiments. An asterisk (*) indicates that the detected differences were significant (P < 0.05).

