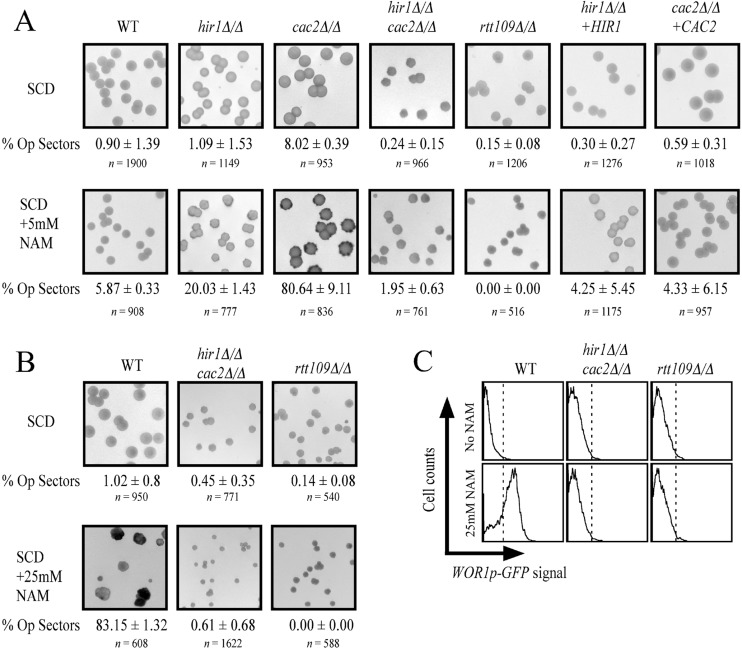
Fig 5.
Interplay between H3K56 hyperacetylation and histone chaperone mutants in epigenetic switching. (A) White cells of the indicated strains were plated to synthetic complete medium containing 2% dextrose (SCD) and SCD supplemented with 5 mM nicotinamide and scored for opaque sector formation after 2 weeks growth at room temperature. The images shown are of representative agar plates with colonies and were taken using a Fujifilm LAS-4000 imager set to detect GFP fluorescence. The colonies are at a magnification of ×3, similar to the insets in Fig. 2D. The GFP fluorescence is seen as dark grey, whereas a lack of GFP signal displays as light grey. Correct phenotypes were also determined by correct cellular morphologies. “% Op sectors” is the percentage of total colonies displaying a sector that switched phenotypes (average ± standard deviation for independent tests done for each strain). A total of 2 or 3 independent tests were done on different days for each strain. (B) Similar switching assay, except that nicotinamide was at a concentration of 25 mM. (C) Flow cytometry detecting WOR1p-GFP fluorescence in cells taken from panel B.

