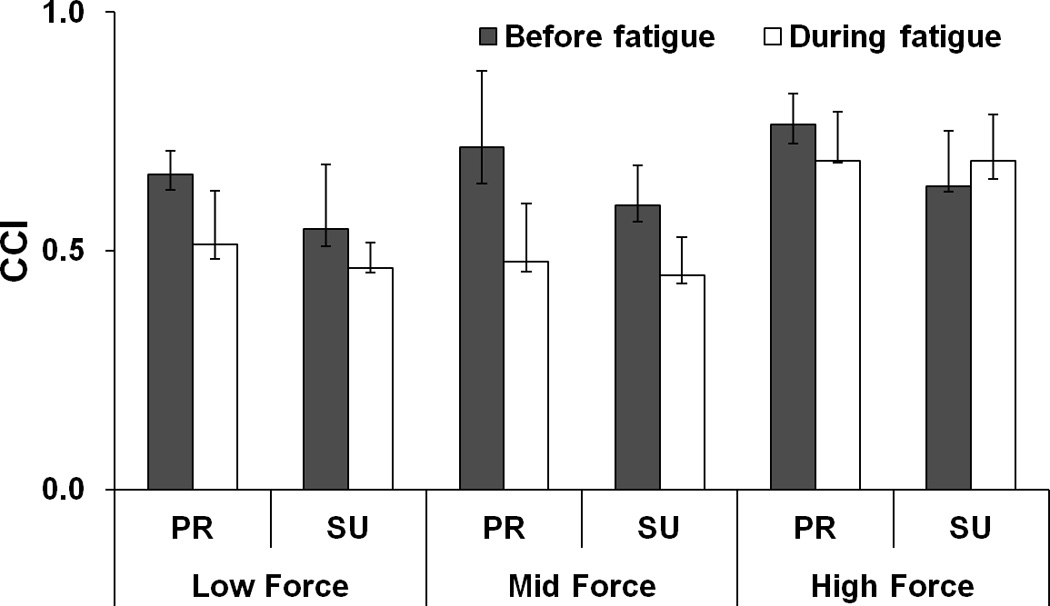
Figure 3.

Co-contraction index (CCI) for different {FTOT; MTOT} combinations before fatigue (black bars) and during fatigue (white bars). The average values across subjects are presented. The error bars represent the lower and upper quartiles of the data distribution (25% – 75%). Low, Mid, and High forces correspond to the ranged of 10 – 20%, 25 – 35%, and 40 – 45% of MVCIMRL, respectively. PR and SU stand for pronation and supination, respectively.
