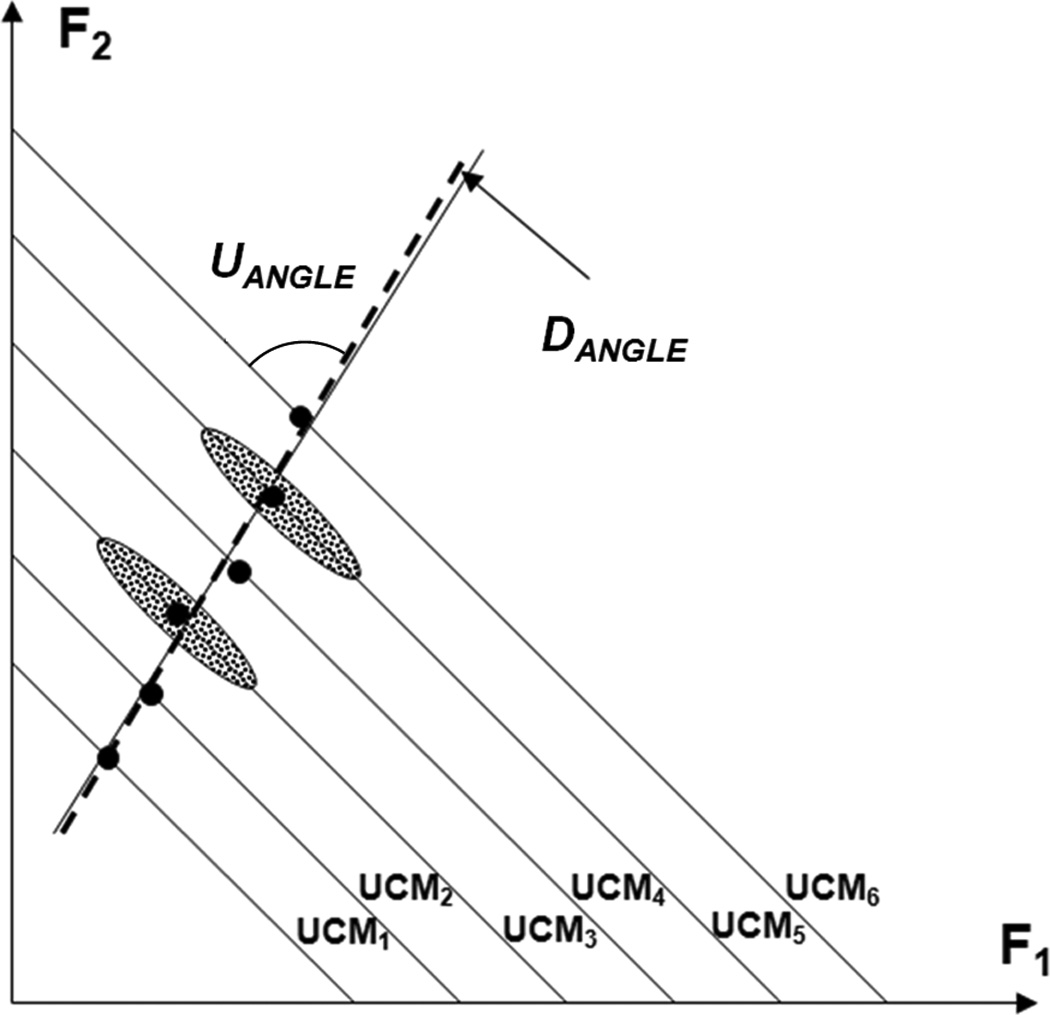
Figure 8.

An illustration of the main ideas with an imagined two-digit force production task. Data over the first session (ANIO analysis) are represented with large dots; data over the second session (UCM analysis) are represented by ellipses. The lines with negative slopes are the UCMs. Note the angle between the space (line) of optimal solutions (the thick dashed line) and the UCM, which differs from 90° (UANGLE < 90°). Note the small angle between the space of experimental observations (the thin solid line) and space of optimal solutions.
