
Figure 3.
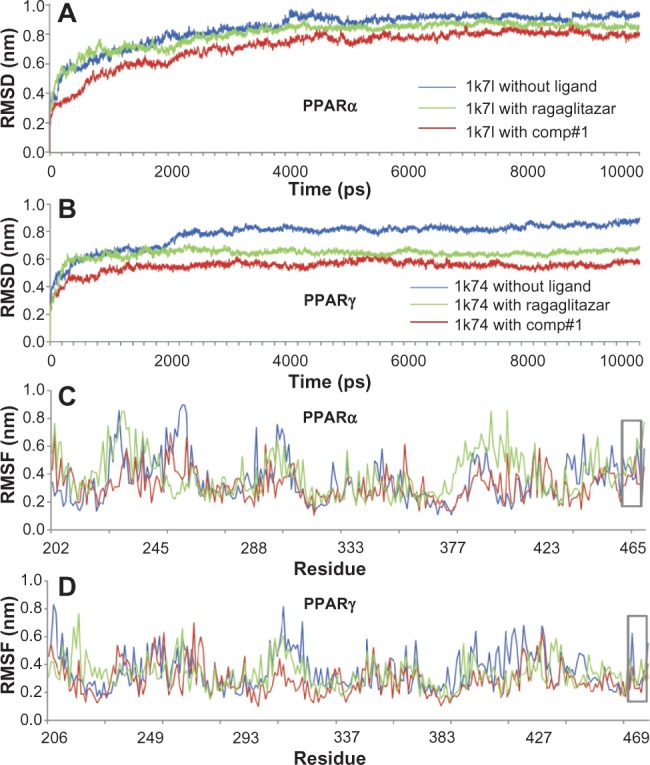
Illustration to show the outcomes of molecular dynamic simulations for the interactions of the receptors with Comp#1 – the best derivative found in this study, as shown in Table 1. (A) The RMSD of all backbone atoms for the receptor PPARα. (B) The RMSD of all backbone atoms for the receptor PPARγ. (C) The RMSF of the side-chain atoms for the receptor PPARα. (D) The RMSF of the side-chain atoms for the receptor PPARγ.
Notes: The blue line indicates the outcome for the system of the receptor alone without any ligand; the red line indicates the outcome for the system of the receptor with the ligand Comp#1; and the green line indicates the outcome for the system of the receptor with the ligand Comp#1. The curves involved with the AF2 helix region are framed with the grey box.
Abbreviations: RMSD, root mean square deviation; PPARα, peroxisome proliferator-activated receptor-alpha; PPARγ, peroxisome proliferator-activated receptor-gamma; RMSF, root mean square fluctuation.