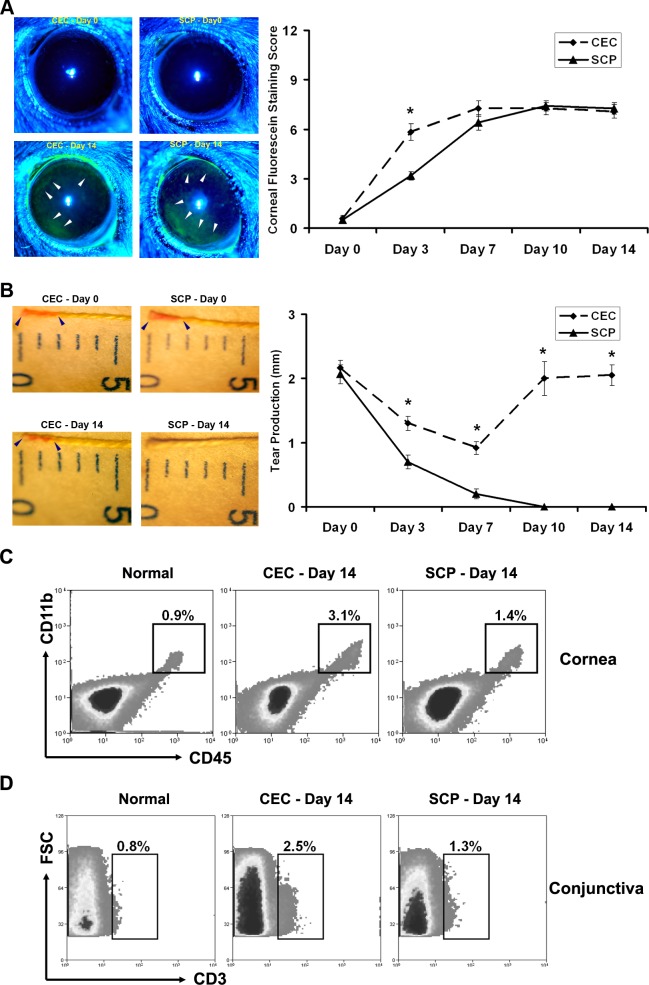
Figure 1.
Evaluation of DED. DED was induced using either a CEC or systemically administered SCP. (A) Corneal epithelial damage assessment by standard corneal fluorescein staining scores. Representative images of normal (day 0) and dry eye (day 14) corneas from each group are shown on the left. The corneal epithelial defect is exhibited as green staining (white arrowhead). *P < 0.05. (B) Aqueous tear production assessment by CTT. Representative images of normal (day 0) and dry eye (day 14) tear measurement from each group are shown on the left. The tear production is measured as the length of red staining (distance between the two blue arrowheads in each image). Data shown represent the mean ± SEM of a single representative experiment (12 eyes from 6 mice per group). *P < 0.05 between CEC and SCP groups. (C) Flow cytometry analysis of corneal CD11b+ cells. A total of 12 corneas was pooled in each group. Percentages represent CD45+CD11b+ cells as a proportion of total corneal cells. (D) Flow cytometry analysis of conjunctival CD3+ T-cells. A total of 12 conjunctivae was pooled in each group. Percentages represent CD3+ T-cells as a proportion of total conjunctival cells.

