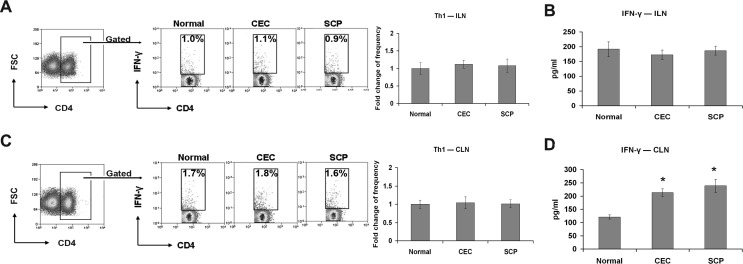
Figure 2.
Th1 cell response evaluation. Distant ILN (A, B) and DED draining CLN (C, D) were harvested for Th1 frequency analysis and signature cytokine level quantification. The experiment was repeated twice with 6 animals in each group. (A, C) Representative flow cytometry dot plots from one of the experiments are located on the left. Percentages represent Th1 cells as a proportion of total CD4+ T-cells in normal, CEC-challenged, and SCP-challenged mice. The fold changes (mean ± SD) of Th1 cell frequencies in CEC and SCP groups relative to normal group are summarized for all the repeated experiments, and presented as a bar graph located on the right. (B, D) IFN-γ protein levels in each group were measured with ELISA. Data represent the mean ± SD of 6 mice from one representative experiment. *P < 0.05 when compared to normal group.

