Figure 5.
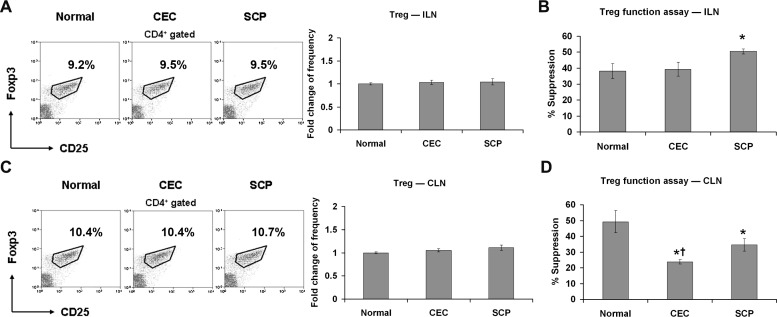
Treg response evaluation. Distant ILN (A, B) and DED draining CLN (C, D) were harvested for Treg frequency and functional analysis. The experiment was repeated twice with 6 animals in each group. (A, C) Representative flow cytometry dot plots (Treg percentage of total CD4+ T-cells) from one of the experiments are displayed on the left. The fold changes (mean ± SD) of Treg cell frequencies in CEC and SCP groups relative to normal group are summarized for all the repeated experiments and presented as a bar graph located on the right. (B, D) Suppression of T-cell proliferation by Tregs was assessed using an in vitro suppression assay as shown on the right. Data are presented as the mean ± SD of 6 mice and each sample was measured in triplicates. *P < 0.05 when compared to normal group. †P < 0.05 between CEC and SCP groups.

