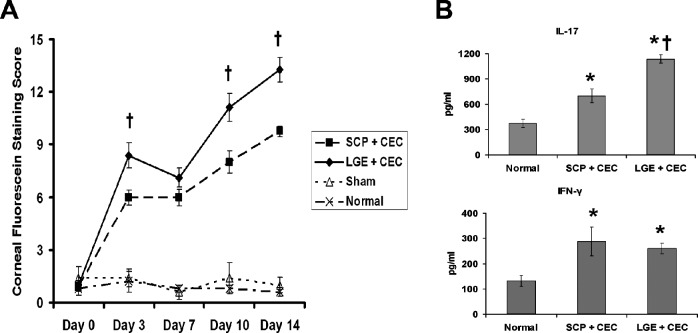
Figure 6.
Disease severity and pathogenic T-cell responses in DED induced by physical removal versus pharmacologic blockade of lacrimal gland. SCP and LGE groups were placed in the CEC for 14 days, and DED draining CLN were collected for examination of Th1 and Th17 responses. (A) Clinical disease severity was evaluated with CFS. Data are the mean ± SEM of five mice at each time point. (B) IL-17 and IFN-γ levels in CLN detected by ELISA. Data are presented as the mean ± SD of five mice. *P < 0.05 when compared to normal group. †P < 0.05 between SCP and LGE groups.

