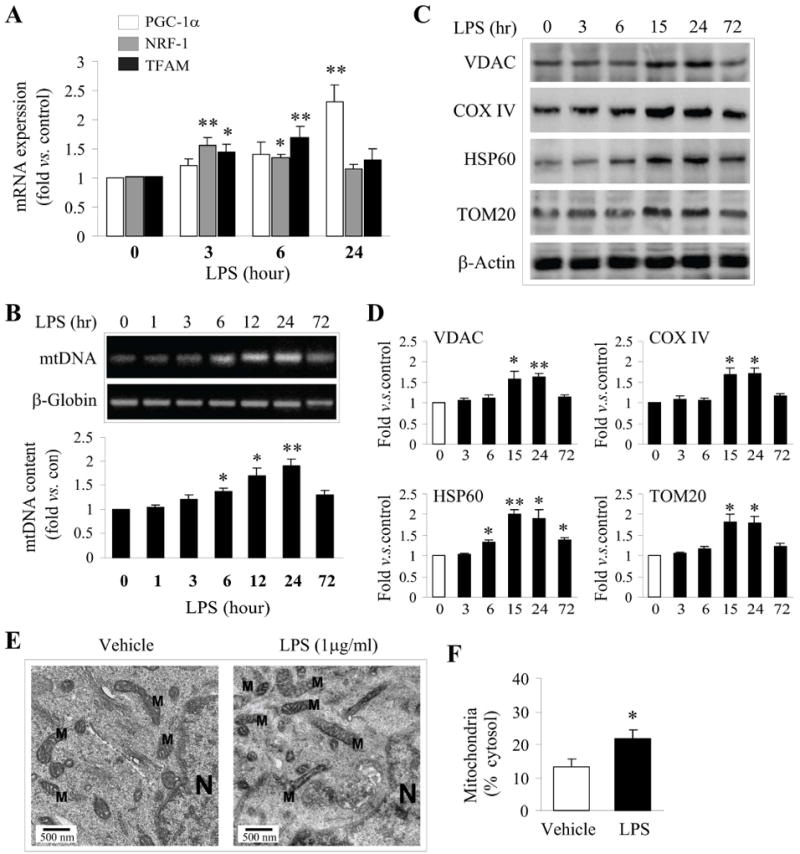
Figure 2. Preconditioning by LPS induces molecular markers of mitochondrial biogenesis in neuron cultures.

A. The mRNA levels of critical transcription factors (PGC-1a, NRF-1 and TFAM) involved in mitochondrial biogenesis were assessed by real-time PCR over 24 h following 1ug/mL of LPS addition to cultures. B. Mitochondrial DNA (mtDNA) content was assessed by long chain PCR following exposure to 1μg/mL of LPS. Bands were semiquantified and expressed as fold increase over controls. C. Representative Western blots showing increased protein expression of VDAC, COXIV, HPS60 and TOM20 after LPS exposure in a time-dependent manner. D. The semi-quantified results (fold increase over controls) of C are illustrated in the graphs. All quantitative data (A-D) are mean±SE, from 3-4 independent experiments using cultures of different dams. *p<0.05, **p<0.01 compared to controls (timepoint “0”). E. Representative electron microscopic images (EM) from neurons exposed to vehicle and 1ug/mL LPS for 24 h, respectively, showing structures for mitochondria (M) and nucleus (N). F. Semiquantitative analysis of mitochondrial mass by assessing the percentages of cytosol occupied by mitochondrial structures in randomly selected EM images. Data were derived from 5 consecutive sections per cell, using a minimum of 3 cells per condition and 3 independent experiments. Statistical analysis was based on a paired student t-test, *p<0.05 versus vehicle.
