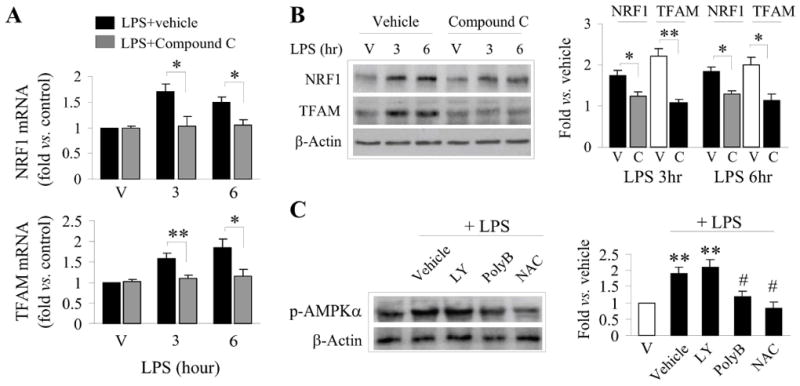
Figure 5. Activation of AMPK contributes to LPS-induced biogenesis.

A,B. LPS induced mRNA (A) and protein (B) expression of NRF1 and TFAM in the presence or absence of the AMPK inhibitor, Compound C (20 μM). V=cultures exposed to vehicle. Semiquantitative data of protein expression are illustrated in the graph (right panel of B). C. Inhibition of TLR (polymixin B, polyB, 10μM) and ROS (NAC, 1mM) block LPS-stimulated AMPK activation. Semiquantitative data of p-AMPKα are illustrated in the graph (right panel of C). Data were from 3-4 independent cultures, expressed as fold change versus vehicle (non-LPS) treated cultures, and statistically analyzed using ANOVA and post hoc Bonferroni/Dunn tests. *p<0.05, **p<0.01 compared to vehicle, #p<0.5 compared to LPS-only challenged cultures.
