FIGURE 2:
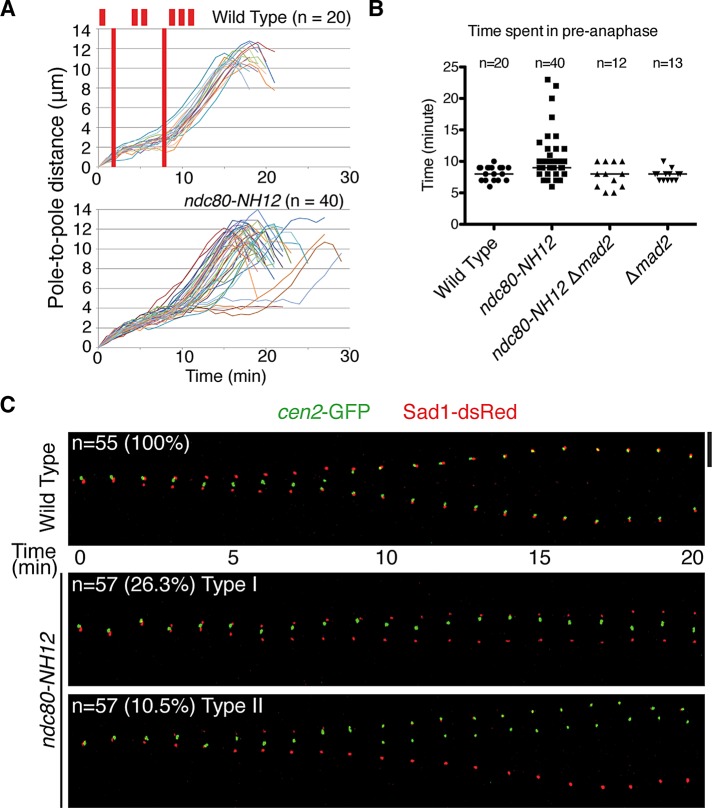
The ndc80-NH12 mutant displays two types of mitotic abnormalities. (A) Profiles of mitotic progression. Wild-type and ndc80-NH12 cells that contained Sad1-dsRed (an SPB marker) and cen2-GFP (a GFP-tagged centromere on chromosome II) were grown at 27°C and shifted to 36°C. Mitotic cells were recorded under a fluorescence microscope, by which the distance of the two SPBs was measured and plotted against time (n = 20 for wild type and n = 40 for ndc80-NH12). Phase I is the period of initial spindle elongation (I), whereas phase II represents the duration in which the spindle length is constant (II). Phase III corresponds to anaphase B (III), when spindles elongate toward the cell tips. (B) The duration of the preanaphase stage. The duration of phases I and II was measured in four indicated strains and plotted. The data in A were used for wild type and ndc80-NH12. As for the mad2 deletion (Δmad2) and ndc80-NH12 Δmad2 strains, similar analysis as shown in A was performed (n = 13 and 12, respectively). Note that mitotic delay observed in ndc80-NH12 was abolished by the mad2 deletion. (C) Time-lapse live image analysis of sister centromere behavior. Mitotic wild-type cells (top) or ndc80-NH12 cells (bottom two rows) containing cen2-GFP (green) and Sad1-dsRed (red) cultured at 36°C were recorded (1-min intervals) and converted to kymograph. Top left, sample number (n = 55 for wild type and n = 57 for ndc80-NH12) and percentage of cells showing each phenotype (type I, 26.3%; type II, 10.5%). Type I (middle) displayed mitotic arrest during phase II, whereas type II (bottom) exhibited sister chromatid segregation errors during anaphase without mitotic delay. Scale bar, 5 μm.

