
FIGURE 8:
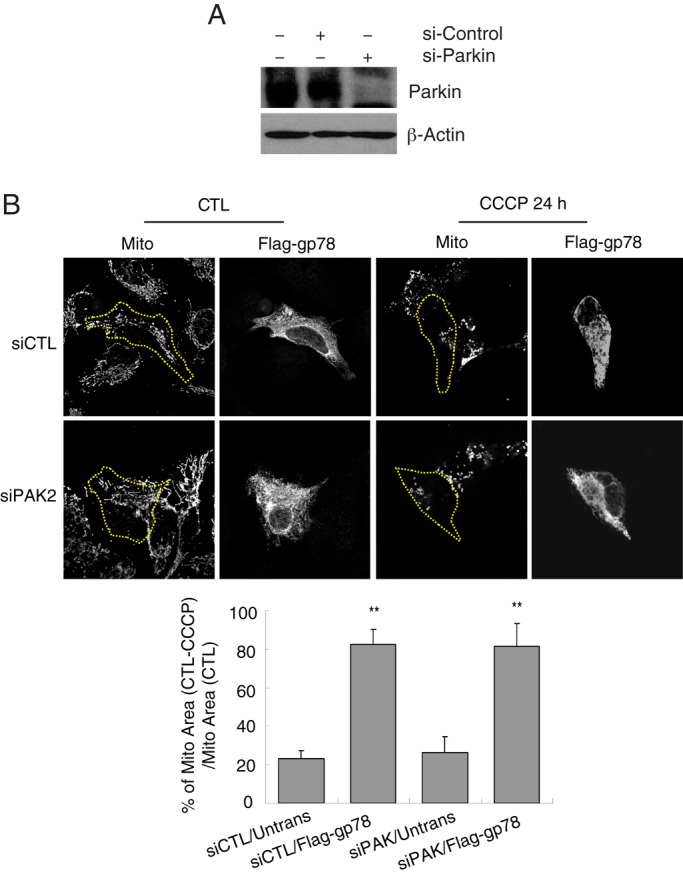
Gp78 induces mitophagy independently of Parkin. (A) Western blots show endogenous Parkin expression in cells transfected with siCTL or siParkin for 48 h. (B) Images of siControl and siParkin HEK293 cells transfected with empty vector or Flag-gp78. Cells were either untreated (UT) or treated with 10 μM CCCP for 24 h (+CCCP) and labeled with Flag and OxPhosV (mito) Abs. Bar graphs show the percentage loss of mitochondrial mass of CCCP-treated cells relative to untreated cells ((mitochondrial area[CTL − CCCP]/mitochondrial area[CTL]) × 100). Mean ± SEM; 10–20 cells/experiment; n = 3, **p < 0.01; see Supplemental Table S1 for mitochondrial area values.