FIGURE 1:
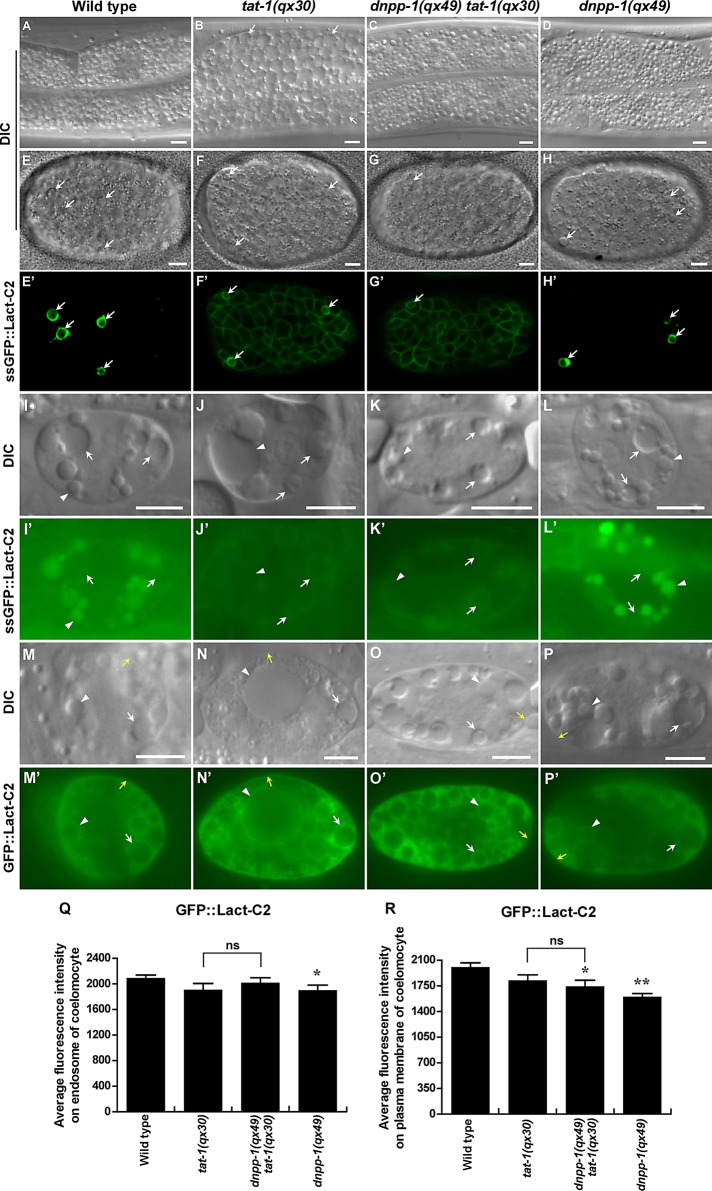
dnpp-1(qx49) suppresses the intestinal vacuolation of tat-1(qx30) mutants without reversing the PS asymmetry defect. (A–D) DIC images of the intestine in wild type (A), tat-1(qx30) (B), dnpp-1(qx49) tat-1(qx30) (C), and dnpp-1(qx49) (D). Abnormal vacuoles are indicated by arrows. (E–P′) DIC and confocal fluorescent images of embryos (E–H′) or coelomocytes (I–P′) in wild type (E, E′, I, I′, M, M′), tat-1(qx30) (F, F′, J, J′, N, N′), dnpp-1(qx49) tat-1(qx30) (G, G′, K, K′, O, O′), and dnpp-1(qx49) (H, H′, L, L′, P, P′) expressing ssGFP::Lact-C2 (PhspssGFP::Lact-C2 in E–H′) or GFP::Lact-C2 (Punc-122GFP::Lact-C2 in M–P′) or taking up and transporting ssGFP::Lact-C2 (Pmyo-3ssGFP::Lact-C2 in I–L′). White arrows indicate cell corpses (E–H′) and endosomes (I–P′); white arrowheads point to lysosomes (I–P′), and yellow arrows indicate plasma membranes (M–P′). Internalized GFP::Lact-C2 is absent from endosomes in wild type and dnpp-1(qx49) single mutants but labels endomembranes in tat-1(qx30) single and dnpp-1(qx49) tat-1(qx30) double mutants. Scale bars: 5 μm. (Q and R) Quantification of average GFP::Lact-C2 intensity on endosomes (Q) and plasma membranes (R) in coelomocytes as shown in M–P′. Data are shown as mean ± SEM. Data derived from different mutant strains were compared with that from wild type. **, p < 1.0 × 10⁻⁵; *, p < 0.05; all other points had p > 0.05. Data derived from dnpp-1(qx49) tat-1(qx30) were also compared with those from tat-1(qx30), and ns indicates that data are not significantly different.

