FIGURE 2:
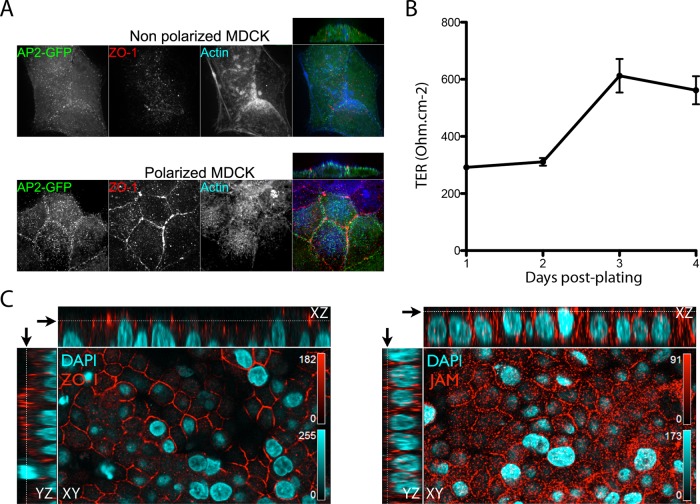
Evidence for MDCK cell polarization and associated localization of JAM-A. (A) MDCK cells expressing AP2-GFP were plated on coverslips 1 d (top: nonpolarized) or 3–5 d (bottom: polarized) before being fixed and then immunostained for actin (blue) and tight-junction protein ZO-1 (red). Images were obtained by spinning-disk confocal microscopy, as described in Materials and Methods. A representative transversal (side) view is also shown for each panel at top right. (B) MDCK cells were seeded on Transwell supports, and the trans-epithelial resistance (TER) was measured at 1, 2, 3, and 4 d after plating. Results are shown as the mean value ± SD from three independent experiments. (C) MDCK cells were grown on Transwell supports for 4 d, and after polarization was confirmed by TER measurement, cells were fixed and then immunostained for tight-junction protein ZO-1 (left: red) and JAM-A (right: red). Nuclei were stained using 4′,6-diamidino-2-phenylindole (blue). Z-series were obtained by scanning confocal microscopy using a Zeiss LSM-780. Representative transversal (side) views are shown for each panel and correspond to the YZ view (left strip) and the XZ view (top strip). Black arrows correspond to the focal-plane display in the XY view toward the top of the cells.

