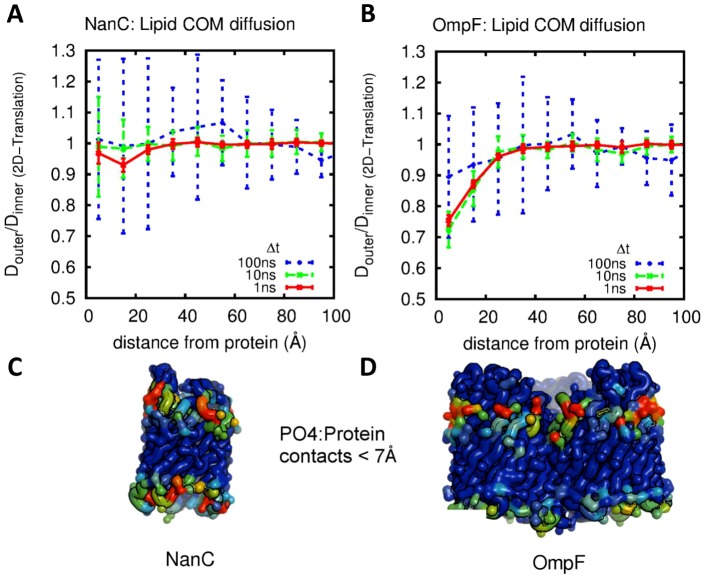
Figure 3. Leaflet asymmetry of diffusion coefficients illustrated for NanC and OmpF.
Ratio of inner to outer leaflet center of mass diffusion coefficients for (A) NanC and (B) OmpF as a function of distance from protein at differing observation time. Error bars are the standard errors of 6×1 µs sub-trajectories, Asymmetry can be seen in the OmpF simulations for distances from the protein of <20 Å. (C,D) Cα trace representations of the corresponding proteins coloured on time averaged number of protein contacts (cutoff 7 Å) to lipid phosphate particles on a blue (0%) to red (100%) scale. Corresponding diagrams for all five proteins can be found in the supporting information, Fig. S4.

