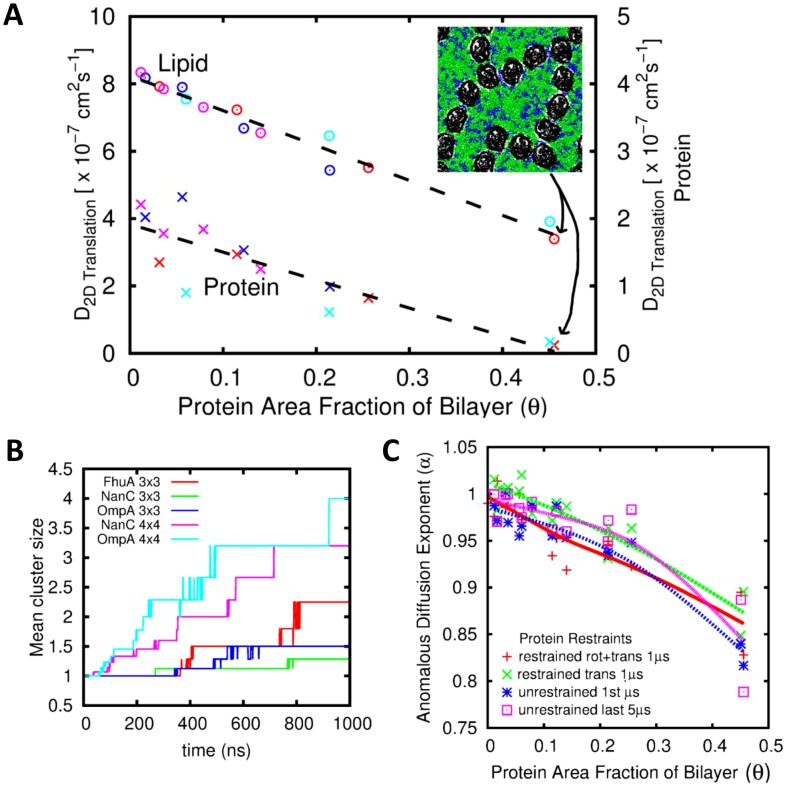
Figure 6.
(A) Center of mass diffusion of lipids (circles; left hand axis) and proteins (crosses; right hand axis) as a function of area fraction of bilayer occupied by protein (θ), for Δt = 20 ns. Magenta = OmpA system; dark blue = NanC; red = FhuA; cyan = OmpF. The inset figure shows a snapshot of the 4×4 FhuA system after 1 µs, illustrating how lipids are compartmentalised by a boundary of contiguous interacting proteins. (B) Clustering in the 3×3 and 4×4 simulations, shown using the mean cluster size. (C) Anomalous diffusion exponent α as a function of area fraction of bilayer occupied by protein (θ).

