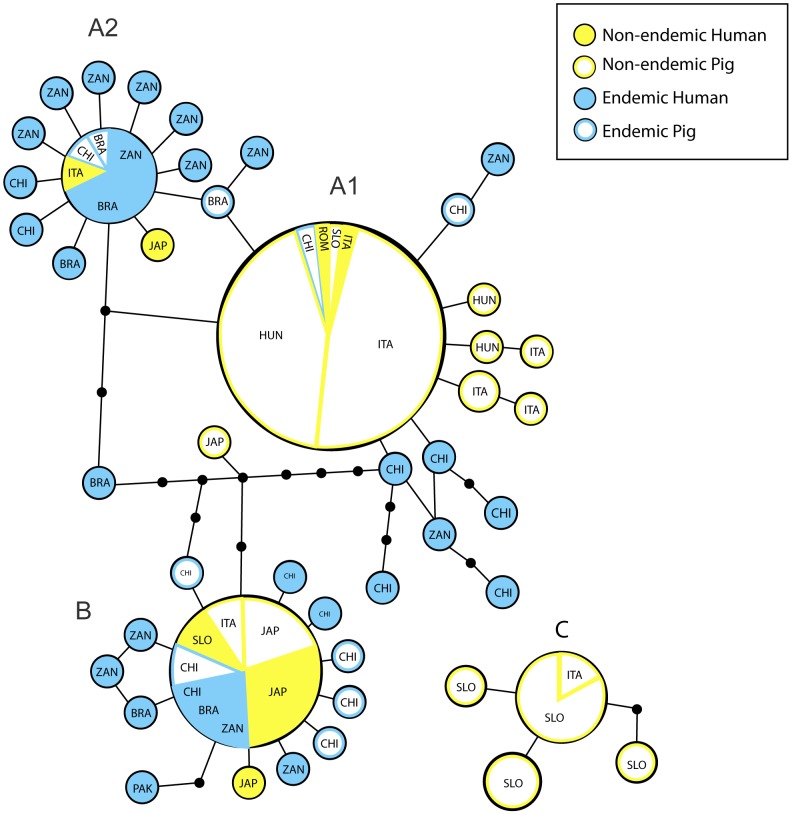
Figure 3. Parsimony network of Ascaris haplotypes.
Parsimony network of the haplotypes observed in the Dataset2, with 95% connection limit. Circles diameter is proportional to haplotypes frequency; circles at branches represent SNPs (A = Cluster A, including subclusters A1 and A2; B = Cluster B; C = Cluster C).

