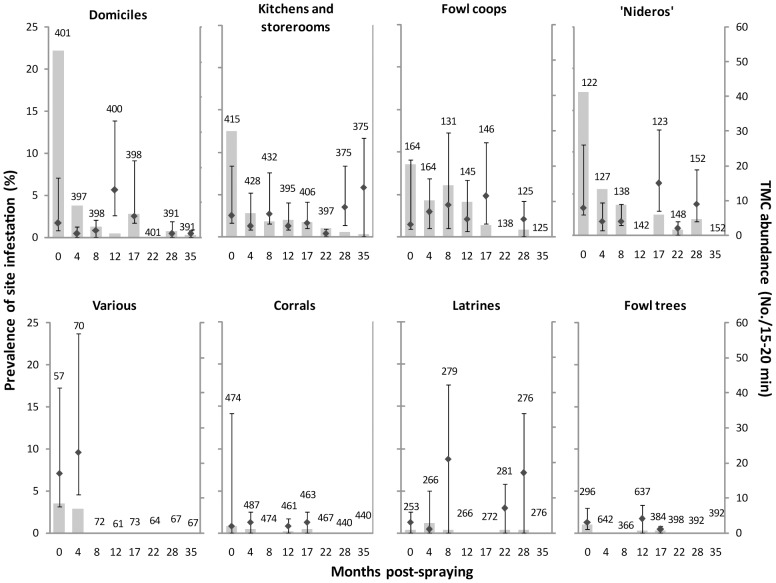
Figure 5. Prevalence and abundance of site-specific infestation with T. infestans according to main type of ecotope.
Pampa del Indio, 2007–2010. Infestations assessed by timed-manual collections (TMC). Only site-level data from the main ecotopes (domiciles, kitchens or storerooms, fowl coops and ‘nideros’) are included. Domiciliary sites numbered 401 because a given house compound may have more than one domiciliary site, in an analog fashion to peridomestic sites. Numbers above bars indicate number of sites inspected. Symbols indicate median bug abundance by TMC in infested sites; whiskers represent the range between the first and third quartiles.

