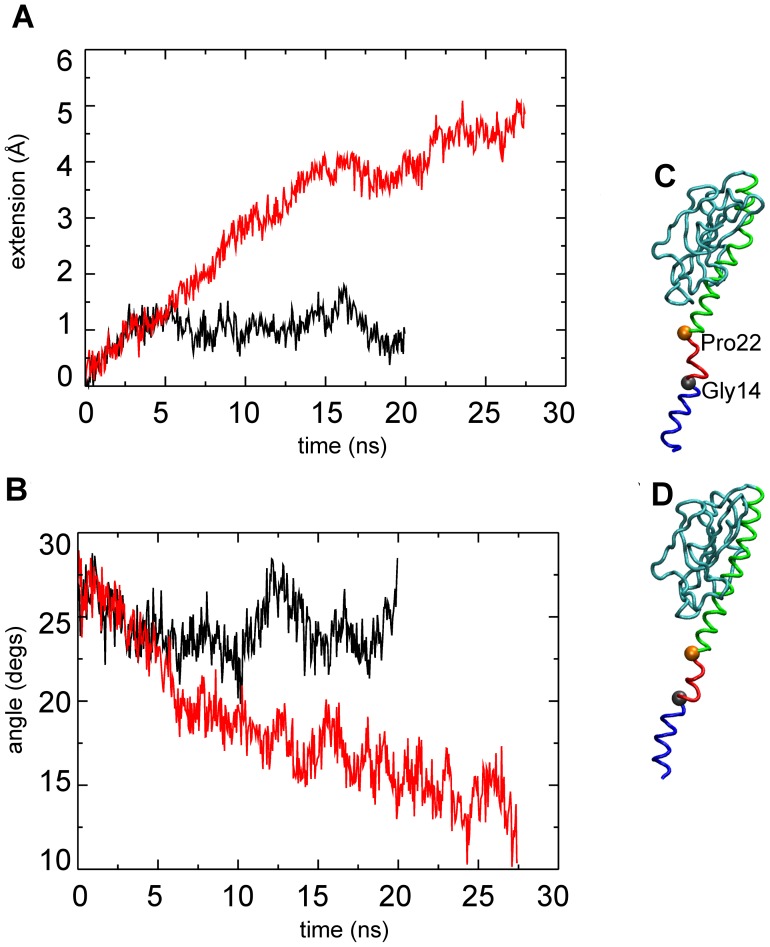
Figure 5. α1 domain extension versus time, and θG angle versus time for “bulk” subunits.
(A) Average extension versus time for the α1 domains and (B) average θG angle. Free simulation (black line) and T4P-v1 (red line). (C) initial and (D) final snapshot of subunit p6 with residues 1–13 (blue), residues 15–21 (red), and residues 23–53 (green).

