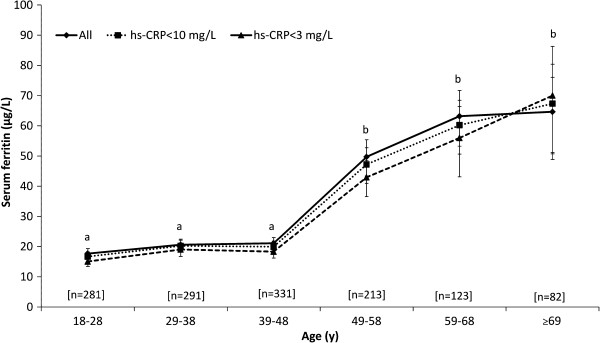
Figure 1.

Serum ferritin concentrations of Inuit women by hs-CRP status and age-group. Values are geometric means (95% confidence interval). For unadjusted ferritin, n are shown on the X axis. Data points without a common letter differ between age-groups for all women. Excluding women with elevated or high CRP did not affect the interpretation of statistical differences.
